10.1 Predefined Templates
Predefined templates show the following types of data:
-
Alarm counts in pie or bar charts
-
SLA status in a dashboard
-
Status and location of an element on a map chart
-
Numeric element properties in a speedometer gauge
These templates can be added to a Web page by using the Chart Builder portlet.
All Chart Builder templates automatically contain a link added to the bottom right corner of the portlet that allows the user to view the source data used to generate the chart. For more information about viewing source data, see Section 7.7, Viewing Source Data for Charts
The following sections show examples of the predefined templates included with the Dashboard and provide steps for deploying charts and configuring the SLA Status Dashboard:
10.1.1 Chart Display Examples
The following sections show examples of the different types of displays:
Alarms Charts
By default, there are four types of charts that show alarm data.
-
Element Alarms Pie Chart, as shown in Figure 10-1
-
Child Element Alarms Bar Chart, as shown in Figure 10-2
-
Element Alarms Bar Chart, as shown in Figure 10-3
-
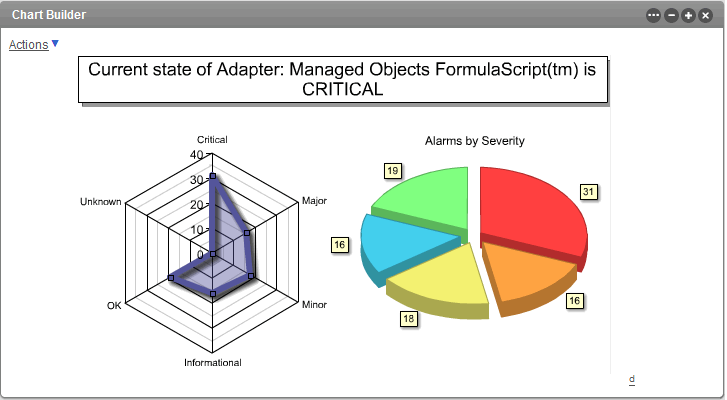
Element Alarms Radar and Pie Chart, as shown in Figure 10-4
The user can click the link located in the bottom right corner of the portlet to view data used to generate the chart.
Figure 10-1 Element Alarms Pie Chart in the Chart Builder Portlet
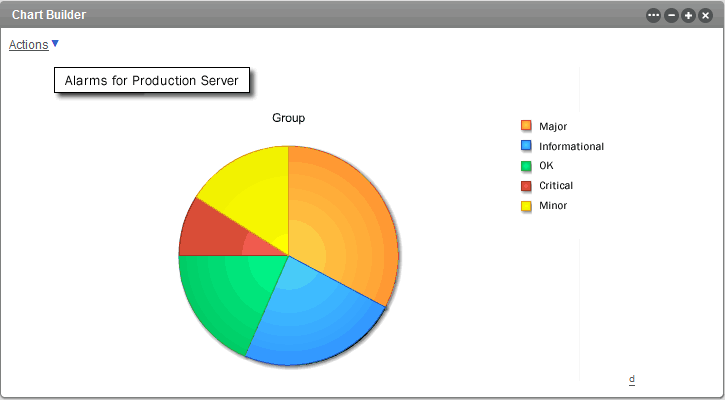
Figure 10-2 Child Element Alarms Bar Chart in the Chart Builder Portlet

Figure 10-3 Element Alarms Bar Chart in ChartBuilder Portlet

Figure 10-4 Element Alarms Radar and Pie Chart in Chart Builder Portlet
Map Chart
The Map Chart template shows a map from the hierarchy tree in Operations Center with drill-down to show alarm charts. The user can click the link located in the bottom right corner of the portlet to view data used to generate the chart.
Figure 10-5 Maps with Drill-down URL in the Chart Builder Portlet

Element Properties Gauge
The Element Properties Gauge template shows element property information in a gauge speedometer. The user can click the link located in the bottom right corner of the portlet to view data used to generate the chart.
Figure 10-6 Element Property Gauge in Chart Builder Portlet

SLA Status Dashboard
The SLA Status Dashboard template shows service level agreement status information including breach and outage counts overlayed with health, downtime, availability and cost impact levels. The user can click the link located in the bottom right corner of the portlet to view data used to generate the chart.
Figure 10-7 SLA Status Dashboard in the Chart Builder Portlet

10.1.2 Deploying Charts
Charts are deployed and configured by using the Chart Builder portlet in the Dashboard.
If some of the chart elements overlap after you configure the chart, increase the chart width.
To configure the Chart Builder Portlet:
-
Add the Chart Builder portlet to a web page.
For more information on adding a portlet to a page, see Section 6.2.1, Adding a Portlet.
-
Click the Configuration icon and select

-
Select a .jsp template from the drop-down list to specify the chart type.
The PCXML files are samples, or templates, that administrators use to create a new chart. They are not fully coded to show custom static data or dynamic information from Operations Center.
Click to upload a new chart template from your file system.
-
Specify the chart width in the field.
-
Specify the chart height in the field.
-
Click the drop-down list, then select the output type.
-
Specify other chart options as required, such as the chart title.
For specific information about running the SLA Status Dashboard template example, see Section 10.1.3, Setting Up the SLA Status Dashboard.
-
Click to save the chart settings.
-
Click to open the tab and select an element to drive the portlet.
-
Click to save the element selection.
10.1.3 Setting Up the SLA Status Dashboard
The SLA Status Dashboard uses data from the Service Level Manager (SLM) in Operations Center and has different configuration options. Using this chart requires a license for SLM. For more information about SLM and SLA data, see the Novell Operations Center 5.0 Service Level Agreement Guide.
Cleared breaches can be included in the Dashboard, even if they are not included in the summary metrics and statistics. This can occur when a breach is cleared on a day that is not included in the reported interval.
To set up custom chart options for the SLA Status Dashboard template:
-
Follow the basic directions to setup the Chart Builder portlet and use the tab to select an element to drive the portlet. See Section 10.1.2, Deploying Charts.
-
Click to select the element with the associated SLA.
-
Select the value by using one of the following time selectors:
Use Interval: Use the options to select an interval range for running the report. Time intervals are always determined relative to the time that the report is run.
Use Date Range: Use the options to select a specific start and end time to include in the report. Click the () icon to select the date/time.
Use Real-Time: Reports on real-time data.
-
To specify an agreement name in the field, click to browse, then select an applicable agreement:
-
None: Shows information for an element.
-
Objective: Shows information for an objective. First, select an option, then specify the objective in the option.
If no agreement is selected, the health displays as 100 with 0 breaches existing (if breaches are selected to display).
-
-
To specify an objective in the field, click to browse and select an applicable objective:
-
To show information for an element, specify .
-
To show information for an agreement, specify , then specify the agreement in the option.
-
-
Select the appropriate check boxes.
-
Specify a title in the field.
-
Select the check box to include a cost total amount in the portlet display.
-
Set the options to configure the cost calculation:
-
Click drop-down list, then select the metric that drives the cost calculation.
-
Specify a to facilitate cost calculations.
-
Specify an to multiply the cost impact per metric instance.
-
-
Select one or more of the following check boxes to customize the display:
Show Costs in Chart: Cost values.
Show Health in Chart: Health indicators. If no agreement is selected, health displays as 100%.
Show Availability in Chart: Availability data.
Show Downtime in Chart: Downtime data. Click the drop-down list, then select the interval display for downtime data.
Show Outages in Chart: Outages.
Show Outages Not Generated by Element Condition Changes: Manually created outages.
Show Breaches in Chart: Breaches. If no agreement is selection, no breaches display.
Show Cleared Breaches: Cleared breaches.
Show Warning Breaches: Warning breaches.
Show the Last Updated Date/Time: Date and time of the last data update.
-
Click to save the chart settings.