6.5 Monitoring the Health of SSL VPN Servers
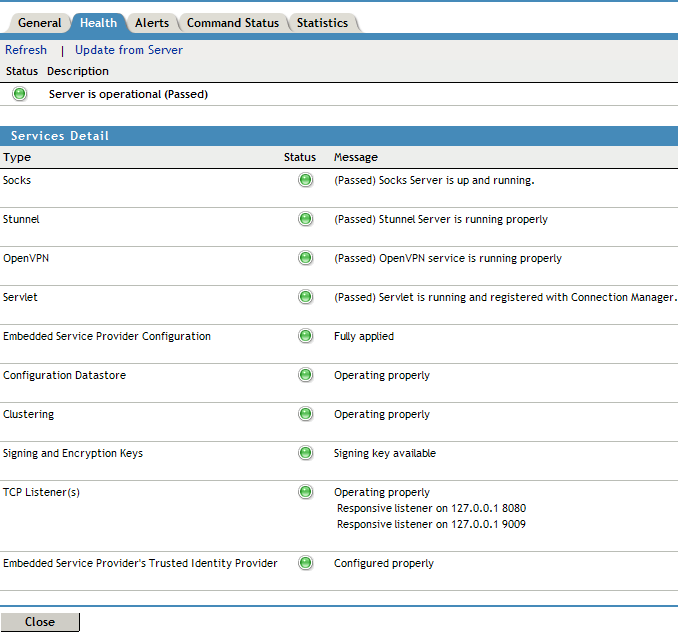
You can monitor the health of an SSL VPN Server through the Health page, which displays the current status of the server.
6.5.1 Monitoring the Health of a Single Server
-
In the Administration Console, click > [Server Name] > .

The column displays the current state, and the column explains the significance of the current state.
The section provides the following information:
Type: Displays the type of service.
Status: Displays the status of the service.
Message: Displays a description of the status of the service.
-
To reload the current page with the latest status, click .
-
To send a request to the agent to update its status information, click . Click in the confirmation dialog box. This can take a few minutes.
-
To close the Health page, click .
6.5.2 Monitoring the Health of an SSL VPN Cluster
You can monitor the health of an SSL VPN Server through the Health page, which displays the current status of the server.
-
In the Administration Console, click > [Cluster Name] > .

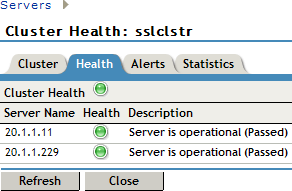
The section displays the current state, and the column explains the significance of the current state.
The section provides the following information:
Server Name: Displays the name of the SSL VPN server in the cluster.
Health: Displays the health status of the server. The following health states are possible:
Icon
Description

A green status indicates that the server has not detected any problems.

A red status with a bar indicates that the server is stopped.

A white status with disconnected bars indicates that the server is not communicating with the Administration Console.

A yellow status indicates that the server might be functioning suboptimally because of configuration discrepancies.

A yellow status with a question mark indicates that the server has not been configured.

A red status with an x mark indicates that the server configuration might be incomplete or wrong, a dependent service might not be running or functional, or that the server is having a runtime error.
Click the icon to get the health status of individual servers.
Description: Displays a description of the status of the server.
-
To reload the current page with the latest status, click .
-
To send a request to the agent to update its status information, click . Click in the confirmation dialog box. This can take a few minutes.
-
To close the Health page, click .