A.3 Health Debugger
Several objects modeled by the Orchestration Console have a health fact that can be used to visually show the health of the object or to trigger a job (see Section 13.0, The Orchestration Server Job Scheduler) upon a state change. This fact can optionally be manually set, or more usually automatically set through the periodic execution of the health constraint placed on that object. When such a health constraint is active, you might need to debug to discover the reasons for the changed state. The Health Debugger is a useful debugging tool.
The Health Debugger is a tabbed page (sometimes called an “admin view”) available in several views of the Orchestration Console and functions much like the more generic “Policy Debugger.” This tool helps you to determine the reasons for the current Health of a Grid object. The following figure shows the Health Debugger tab opened in the Resource object view of the Orchestration Console.
Figure A-2 Orchestration Console Jobs View with the Health Debugger Page Open
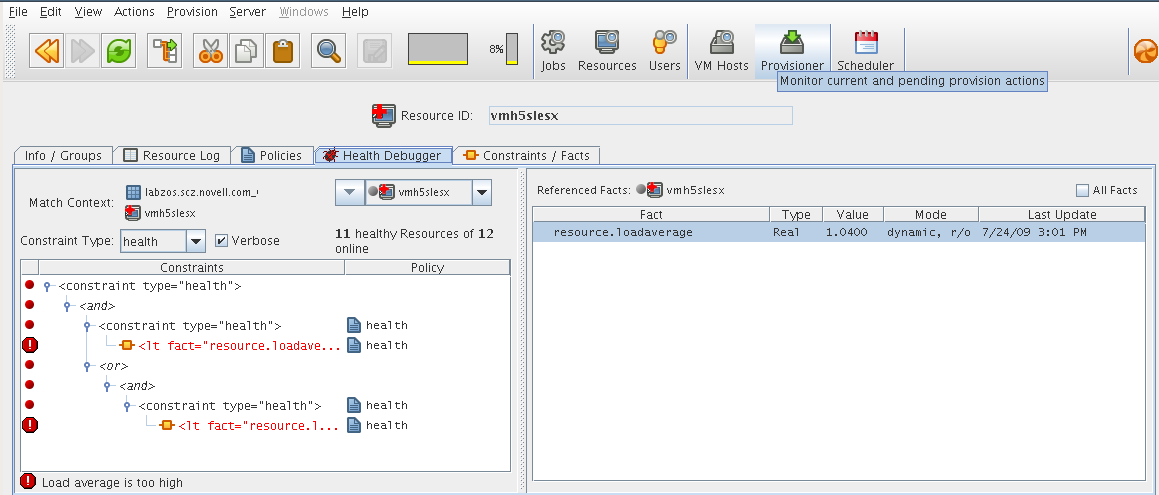
The Health Debugger tab is also available in the VM Host object view, the Repository object view and in the User object view of the Orchestration Console.
A.3.1 Constraints Table Panel
The left side of the Health Debugger page is referred to as the Constraints Table view.
Figure A-3 The Constraints Table View
The appearance of this view can change, depending on the Constraint Type you select in the Constraint drop down list. In effect, if you change from the health selection, you will be debugging other constraints. For a description of these constraint types, see Section 14.1.2, Constraint Type List. Different objects selected for the view change the in which the constraint is executed, which is useful for comparing how the constraint evaluates other objects.
The Constraints Table view is composed of several parts:
Match Context Area
The Health Debugger provides the general identification of a Grid object in the area of the Constraints Table view. The Match Context defines every object that is available to the constraint you are viewing.
Figure A-4 The Match Context Area of the Constraints Table View in the Health Debugger
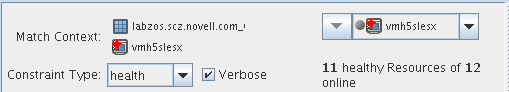
In this example, the identifying Facts in the Match Context include:
Matrix:
The  icon and a text string identifies the machine that matches the grid name given to the Orchestration Server where this object exists.
Object icon: The object icon and a text string identifies the object (VM host, Repository, or that matches the user who is running the job. If the object icon has a red cross overlaid, it is unhealthy.
Object list:
The object drop down list shows all named objects of the type selected in the Explorer Tree. The objects in the list that are currently offline display with a dimmed icon. If available, a listed object has a colored dot by its side. The color of the dot (blue  or gray
  ) and the object type it accompanies has significance:
-
-
A blue dot with the label indicates that at least one object in the list matches the constraints and is healthy.
-
A gray dot with the label indicates that no objects of this type match the constraints.
-
A blue dot with a named, selected object indicates that its constraints match and it is healthy.
-
A gray dot by a named, selected object indicates that its constraints do not match and that it is not healthy.
-
Verbose Check Box
When you select the Verbose check box, the reason string specified in the policy is displayed in the tree. For more information, see Section 14.1.5, Constraints Column of the Constraints Table View.
Capable Objects Summary
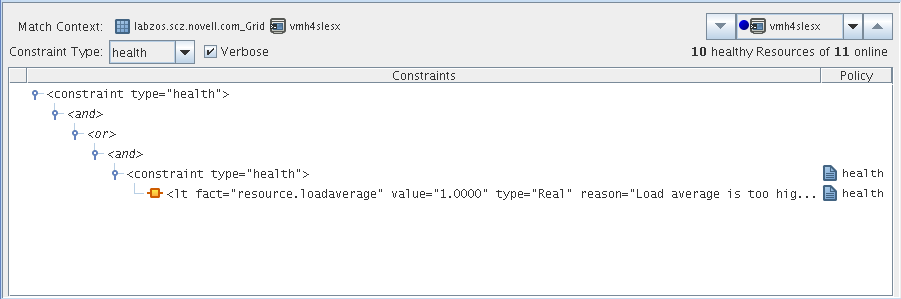
Directly under the Object list in the constraint view, a populated string summarizes the resources that are capable of servicing the job. For example, 11 healthy Resources of 12 online indicates that 11 of the 12 total online Resources are healthy.
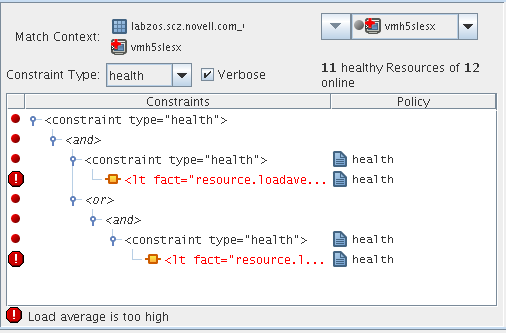
Constraints Column of the Constraints Table View
The Constraints column of the constraints table view shows the logical hierarchy (that is, a “tree” format) of the constraints that are defined by the Policies associated with the Job. You can identify the status of the listed constraints by the icons that might be displayed in the far left column of the table:
No icon: no icon: The constraint passes the match. It is a “true” match. No red icons are displayed next to any listed constraint.
Red dot icon: The constraint does not pass the match. The figure below shows that the resource vmh5slesx cannot run the job because its health constraints do not match.
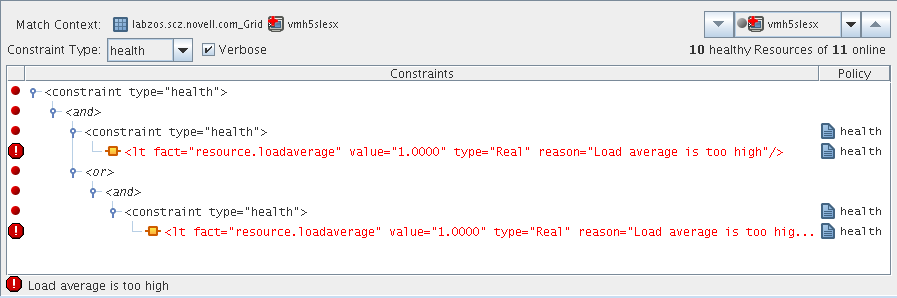
Red octagonal icon: For convenience, only one of the constraints is identified as the blocking constraint. This is the constraint that the system has determined is responsible for the constraint as a whole to fail (note that individual constraint lines can fail without causing the entire constraint to fail).
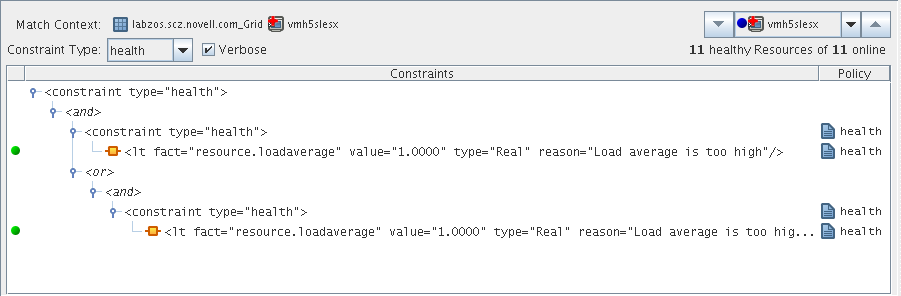
Green dot icon: green dot icon: A failing constraint has been disabled so that it behaves like a match (pass). The figure below shows the green dot icon next to that the constraint that was formerly failing and can now be forced to behave as a match.
If you right-click a constraint in the table, a popup menu with three options is displayed. This menu lets you change the status of the constraint. Disabling a constraint is useful if you want to temporarily relax a condition without editing or redeploying the entire policy and potentially affecting other objects that share the policy. A disabled constraint can be re-enabled later.
The constraint status change options include the following:
-
Show Admin View: Select this option to open the Admin view for the specific object selected.
-
Disable Constraint: Select this option to disable (attach a green dot icon to) a constraint. Disabling a constraint with this function effectively makes it match, a condition that can prove useful if you want to perform a “what if” test without actually changing a policy. Green
-
Enable All Constraints: Select this option if you have disabled one or more constraints during testing and you want to restore them to the enabled state.
NOTE:Health constraints are always re-evaluated in the debugger. The last system execution (cached constraint) is not available for health constraints.
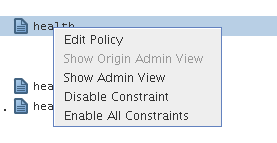
The Policy column of the constraints table displays the policy name that contributed the constraint. Right-click a policy name to open a popup menu offering the option to open the policy editor for the specified policy. The menu also includes constraint enabling or disabling options, just as the pop-up menu for constraint column does.
Figure A-5 The Pop-up Menu Launched from the Policy Column
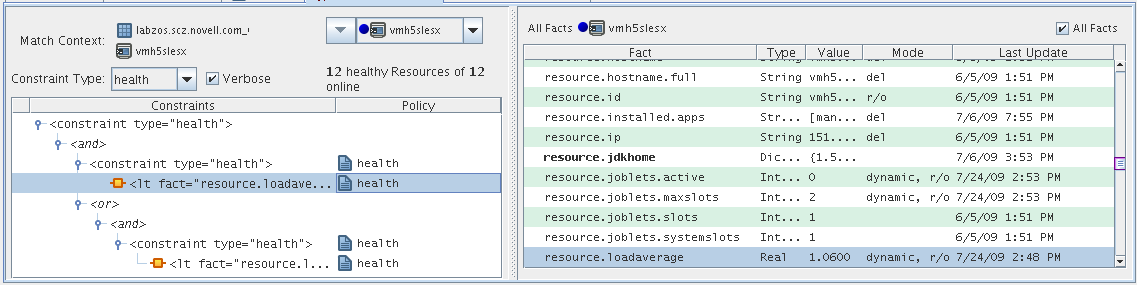
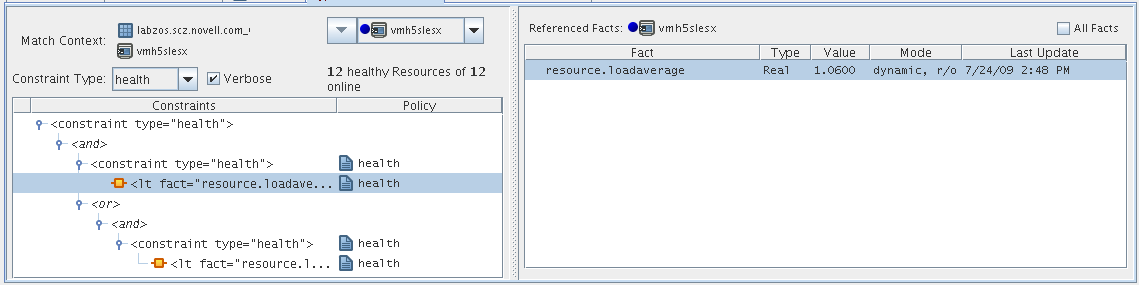
A.3.2 Facts Table View
The Facts Table view displays the facts referenced in the Constraint Tree view for a specified object. Selecting a fact in the Constraint tree automatically selects that fact in the table.
Figure A-6 The Constraints Table View and the Accompanying Facts Table View
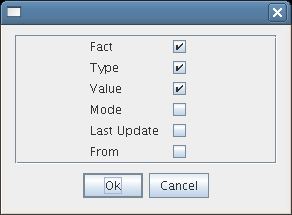
If you right-click a column head in this table, a menu is launched where you can select the columns that you want to display.
Figure A-7 Menu Used to Select the Columns Displayed in the Facts Table View of the Policy Debugger
All Facts Check Box
If you select the check box at the top of the Facts Table view, all of the facts (including matrix, and <Object type> facts) associated with the Match Context are listed.
If you select in the Match Context (see Section 14.1.1, Match Context Area) and you also select the check box, the Facts Table view displays all the <object type> facts for the specified Match Context of the selected object.
Figure A-8 All Facts Check Box Selected with All VM Hosts in Match Context