1.2 Understanding Orchestration Functionality
1.2.1 How Do I Interact with the Orchestration Server?
Orchestration administrators and users perform their activities by using their own graphical tool or command line interface tools. In general, the same functions are available in either the graphical or the command line tools. The toolset is summarized in the chart below.
Table 1-1 Summary of the Orchestration Toolset
|
Role |
Tool Type |
Description |
Common Function |
|---|---|---|---|
|
Orchestration Administrator |
Graphical Interface |
The Orchestration Console |
|
|
Command Line Interface |
Sample command line for help:
zosadmin command --help
|
||
|
Graphical Interface |
The Cloud Manager Web Console or a Cloud Manager Mobile Client |
|
|
|
Orchestration User |
Command Line Interface |
Sample command line for help:
zos command --help
|
|
Other functions can also be performed by using either the graphical or command line tools. To help you understand how these tools can be used, you can find more information in the following sections:
1.2.2 How Orchestration Components Communicate
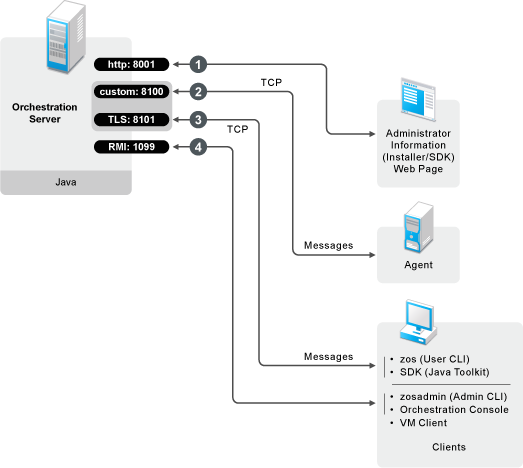
The following diagram illustrates how the various components of Cloud Manager Orchestration communicate with the Orchestration Server. An explanation for each communication link follows the diagram.
Figure 1-6 Communication Ports Used By the Orchestration Server
-
Administrators who want more information about Cloud Manager Orchestration and a method to access or install additional clients or agents can access the Administrator Information page. To do so, open a Web browser and enter the URL to the Orchestration Server, followed by the port designated for the Web Info page during installation. In a basic installation of Orchestration, the default is port 8001. The URL would therefore be entered as follows:
http://DNS_Name_or_IP_Address:8001
-
The Orchestration Server establishes and maintains contact with an installed Orchestration Agent on a computing resource through port 8100, using a custom protocol.
-
When a user invokes the zos command line interface (available after Orchestration clients are installed on a machine), or when using the Java toolkit SDK, those client tools communicate with the Orchestration Server over ports 8100 and 8101.
-
When the administrator invokes the zosadmin command line interface (available after Orchestration clients — including the Orchestration Console — are installed on a machine), or when using the Orchestration Console, those client tools communicate with the Orchestration Server over port 1099, which uses a Java RMI (Remote Method Invocation) protocol.
1.2.3 Resource Virtualization
Host machines or test targets managed by the Orchestration Server form nodes on the grid. All resources are virtualized for access by maintaining a capabilities database containing extensive information (facts) for each managed resource.
This information is automatically polled and obtained from each resource periodically or when it first comes online. The extent of the resource information the system can gather is customizable and highly extensible, controlled by the jobs you create and deploy.
1.2.4 Policy-Based Management
Policies are aggregations of facts and constraints that are used to enforce quotas, job queuing, resource restrictions, permissions, and other user and resource functions. Policies can be set on all objects and are inherited, which facilitates implementation within related resources.
Facts, which might be static, dynamic or computed for complex logic, are used when jobs or test scenarios require resources in order to select a resource that exactly matches the requirements of the test, and to control the access and assignment of resources to particular jobs, users, projects, etc. through policies.This abstraction keeps the infrastructure fluid and allows for easy resource substitution.
Of course, direct named access is also possible. An example of a policy that constrains the selection of a resource for a particular job or test is shown in the sample below. Although resource constraints can be applied at the policy level, they can also be described by the job itself or even dynamically composed at runtime.
<policy>
  <constraint type="resource">
    <and>
      <eq fact="resource.os.family" value="Linux"/>
      <gt fact="resource.os.version" value="2.2" />
    <and>
  </constraint>
</policy>
An example of a policy that constrains the start of a job or test because too many tests are already in progress is shown in the following sample:
<policy>
  <!-- Constrains the job to limit the number of running jobs to a
defined value but exempt certain users from this limit. All jobs
that attempt to exceed the limit are qued until the running jobs
count decreases and the constraint passes. -->

<constraint type="start" reason="Too busy">
    <or>
      <lt fact="job.instances.active" value="5"/>
      <eq fact="user.name" value="canary" />
    </or>
  </constraint>
</policy>
1.2.5 Grid Object Visualization
One of the greatest strengths of the Cloud Manager Orchestration solution is the ability to manage and visualize the entire grid. This is performed through the Cloud Manager Orchestration Console and the Cloud Manager VM Monitoring System.
The desktop Orchestration Console is a Java application that has broad platform support and provides job, resource, and user views of activity as well as access to the historical audit database system, cost accounting, and other graphing features.
The Orchestration Console also applies policies that govern the use of shared infrastructure or simply create logical grouping of nodes on the grid. For more information about the console, see the NetIQ Cloud Manager 2.1.5 Orchestration Console Reference.
1.2.6 Understanding Job Semantics
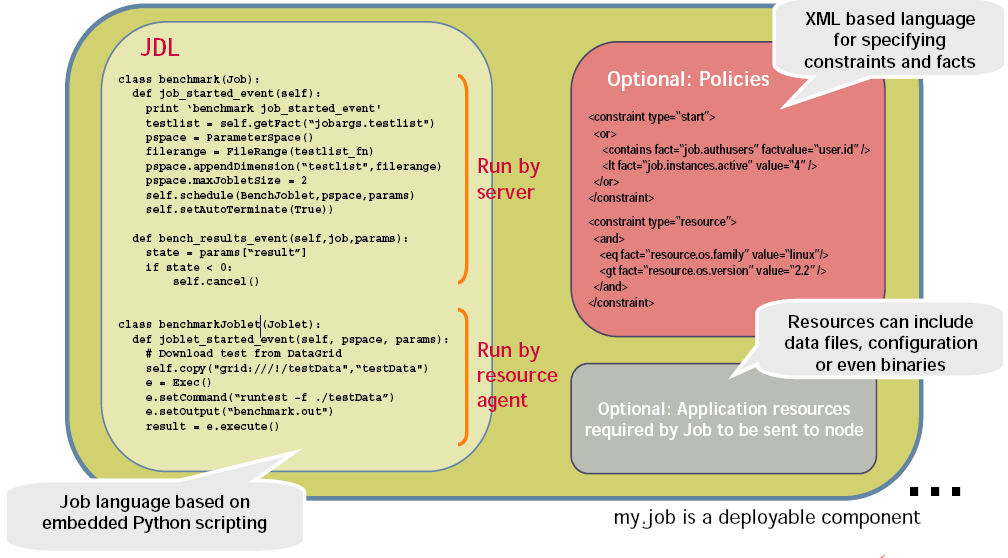
As mentioned earlier, the Orchestration Server runs jobs. A job is a container that can encapsulate several components including the Python-based logic for controlling the job life cycle (such as a test) through logic that accompanies any remote activity, task-related resources such as configuration files, binaries and any policies that should be associated with the job, as illustrated below.
Figure 1-7 Components of a Job
Workflows
Jobs can also invoke other jobs, creating hierarchies. Because of the communication between the job client (either a user/user client application or another job) it is easy to create complex workflows composed of discrete and separately versioned components.
When a job is executed and an instance is created, the class that extends job is run on the server and as that logic requests resources, the class(es) that extend the joblet are automatically shipped to the requested resource to manage the remote task. The communication mechanism between these distributed components manifests itself as event method calls on the corresponding piece.
1.2.7 Distributed Messaging and Failover
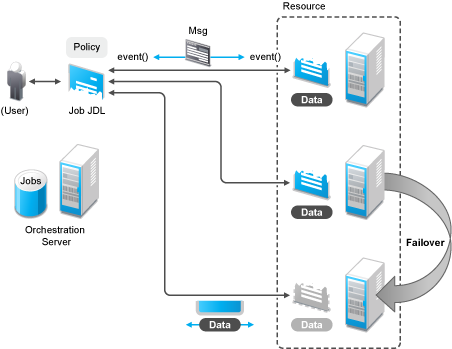
A job has control over all aspects of its failover semantics, which can be specified separately for conditions such as the loss of a resource, failure of an individual joblet, or joblet timeout.
The failover/health check mechanisms leverage the same communications mechanism that is available to job and joblet logic. Specifically, when a job is started and resources are employed, a message interface is established among all the components as shown in Figure 1-8.
Optionally, a communication channel can also be kept open to the initiating client. This client communication channel can be closed and reopened later based on jobid. Messages can be sent with the command
sendEvent(foo_event, params, ...)
and received at the other end as a method invocation
def foo_event(self, params)
If a job allows it, a failure in any joblet causes the Orchestration Server to automatically find an alternative resource, copy over the joblet JDL code, and reestablish the communication connection. A job also can listen for such conditions simply by defining a method for one of the internally generated events, such as def joblet_failure_event(...).
Such failover allows, for example, for a large set of regression tests to be run (perhaps in parallel) and for a resource to die in the middle of the tests without the test run being rendered invalid. The figure below shows how job logic is distributed and failover achieved:
Figure 1-8 A Job in Action