43.2 Understanding the Capacity View
The Capacity view includes three main sections:
43.2.1 Capacity Summary Bar
The Capacity Summary bar provides a summary for the total resources within your management scope.

For example, if you are a Cloud Administrator, you see a summary for all of the resources in your Cloud. If you are a Zone Administrator, you see a summary of all of the resources in the zones you manage. If you are an Approver, you see a summary of all of the resources in your assigned organizations and zones.
Each resource (Memory, CPU, and Storage) has its own capacity indicator. The indicator displays the used and reserved capacity as a percentage of the total available capacity.
The color of the indicator is determined by the Warning and Problem thresholds set for the Cloud environment. Green indicates that no thresholds have been reached, yellow indicates that the Warning threshold has been reached, and red indicates that the Problem threshold has been reached.
The Issues section of the Capacity Summary bar shows the following:
-
 No resource issues.
-
 The number of resources that have reached the Warning threshold.
-
 The number of resources that have reached the Problem threshold.
43.2.2 Organizations or Zones List
The Organizations or Zones list displays the organizations or zones for which you can view resource capacity.
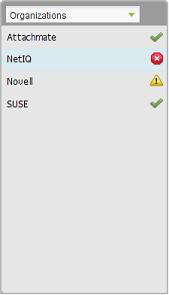
Depending on your role, you might be able to see either organizations or zones but not both.
The icon next to each organization or zone indicates the current status of the resources for that item. The statuses correspond to the statuses that can be listed in the Capacity Summary bar:
-
No resource issues.
-
One or more resources for the organization or zone have reached the Warning threshold.
-
One or more resources for the organization or zone have reached the Problem threshold.
43.2.3 Organizations or Zones Details
The Organizations or Zones Details panel displays the resource capacity information for the organization or zone that is selected in the list.
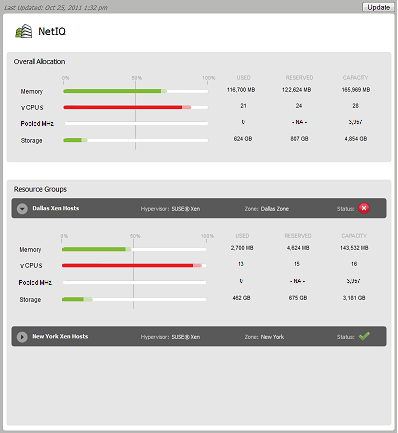
The section provides a summary of the used, reserved, and available capacity for the entire organization or zone. The section shows the same type of information for the each resource group in the organization or zone.
-
Memory: The memory (RAM) resources.
-
vCPUs: The host and cluster virtual CPU resources, represented in number of CPUs. This resource is displayed only if a resource group contains hosts or clusters.
-
Pooled MHz: The resource pool CPU resources, represented in MHz of CPU. This resource is displayed only if a resource group contains vSphere resource pools.
-
Storage: The shared storage resources. This includes SAN (Storage Area Network) and NAS (Network-attached Storage). Local storage is not included.
For each resource, the following information is displayed:
-
Used: The amount of the resource that is actually being consumed by deployed workloads. For example, a workload might be allocated 4 GB of memory but only be using 2 GB.
-
Reserved: The amount of the resource that is reserved for deployed workloads. For example, if a workload is allocated 4 GB of memory, all 4 GB are reserved.
-
Capacity: The total amount of the resource that is available for deployed workloads. For memory from hosts and clusters, the field reflects the total physical memory of the hosts, not just the memory that is available for workloads. For example, a host’s physical memory might be 16252 MB, with the actual memory available for workloads being 10695 MB. Because the field uses the physical memory amount (16252 MB), you might not have as much memory capacity as appears. For memory from resource pools, the field reflects the actual memory pool size.
The sections provide capacity details for each resource group assigned to the organization or zone. The status of each resource group is also displayed.
The field displays the last time the capacity data was updated. The button lets you update the data.