3.1 Managing Dashboard
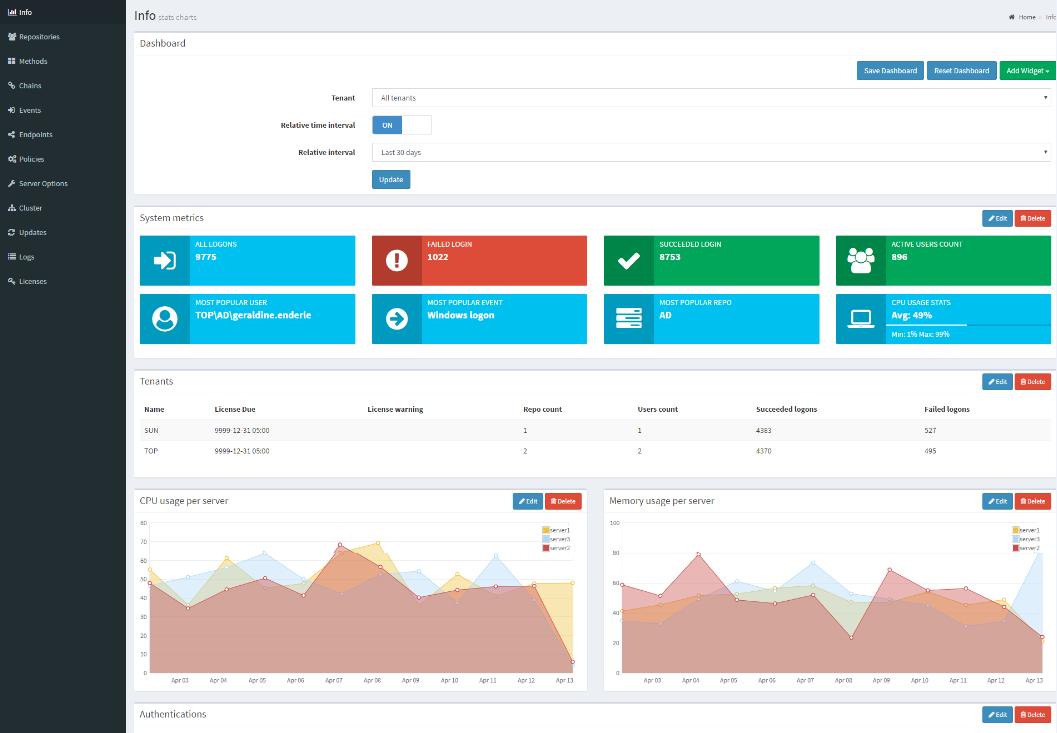
After you login into the Advanced Authentication Administration console, the Dashboard is displayed. Dashboard contains widgets that you can add or customize to view a graphical representation of data. The information in the Dashboard helps administrators to track memory utilization, tenant information, successful or failed logins, and so forth.
You can view the Dashboard for all the tenants or specific tenants.
You can perform the following to manage the Dashboard:
3.1.1 Adding Widgets
To add widgets, perform the following steps:
-
Click Add widget in the top-right corner of the Dashboard screen.
-
Select the widget from the list that you want to add to the dashboard.
-
Specify the appropriate details for the widget in the Add Widget screen.
3.1.2 Customizing Dashboard
You can customize the Dashboard by moving the widgets or deleting the unused widgets.
To move the widgets, click on the widget and the drag icon ![]() appears. You can then drag and drop the widget to the desired location of the Dashboard.
appears. You can then drag and drop the widget to the desired location of the Dashboard.
To delete unused widgets, click Delete on the top of each widget.
After customizing the dashboard, click Save Dashboard on the upper-right corner of the Dashboard screen.
3.1.3 Updating Dashboard to View Real Time or Historical Data
You can update Dashboard to view the data based on the time interval or historical data.
Viewing Dashboard based on Time Interval
To view records based on real time interval, enable Relative time interval to ON and select the Relative interval. The default time interval for Dashboard is 15 minutes.
Viewing Dashboard for Previous Records
To view previous records, enable Relative time interval to OFF and select the Date range.Click Update
3.1.4 Customizing the Default Widgets
Following are the default widgets when you login. You can edit these widgets according to your need:
System Metrics
This widget displays statistics about user’s login, popularity and so on. The following section defines each system metric:
-
All Logons: Total number of logins.
-
Failed Login: Total number of failed logins by the users.
-
Succeeded Login: Total number of successful logins by the users.
-
Active Users Count: The number of active users.
-
Most Popular User: The user that has used the console most.
-
Most Popular Event: The event that users have used the most.
-
Most Popular Repo: The repository that users have used the most.
-
CPU Usage Stats: The average percentage of CPU usage.
Tenants
This widget displays information about the tenants and their login.
CPU Usage Per Server and Memory Usage Per Server
These widgets display information about percentage of CPU and memory usage per time interval. They show average CPU and memory usage.
You can edit the title and change the time interval to view the records.
Servers
This widget displays the CPU, memory, and disk usage.
Authentications
This widget displays the total logon count for time interval. You can edit the display based on the events: All logon events, Failed logon events, or successful logon events.
Logons Per Result
This widget displays two lines: one for successful logons and one for failed logons.
To edit the widget, click Edit and select the appropriate fields. You can also select the number of records from Size and sort in the ascending (previous to latest) or descending (latest to previous) order.
Activity Stream
This widget displays information about user, tenant, chain, and method used for authentication, and the result.
You can edit the display based on the events: All logon events, Failed logon events, or successful logon events.
Successful/Failed Logons
This widget displays information about the successful or failed logins by users. You can edit the widget to customize the display based on the event type and parameters such as Tenant name, event name and so on.
To edit the widget, click Edit and select the appropriate fields. You can also select the number of records from Size and sort in the ascending (previous to latest) or descending (latest to previous) order.
Top Events With Successful Logon Per Chain
This widget displays the top events based on the successful logon for each chain. You can edit the widget to customize the display based on the event type and parameters such as Tenant name, event name and so on.
To edit the widget, click Edit and select the appropriate fields. You can also select the number of records from Size and sort in the ascending (previous to latest) or descending (latest to previous) order.
Top Events With Failed Logon Per Method
This widget displays the top events based on the failed logon for each chain. You can edit the widget to customize the display based on the event type and parameters such as Tenant name, event name and so on.
To edit the widget, click Edit and select the appropriate fields. You can also select the number of records from Size and sort in the ascending (previous to latest) or descending (latest to previous) order.
Top 10 Events
This widget displays the top ten events the user has performed. You can edit the widget to customize the display based on the event type.
To edit the widget, click Edit and select the appropriate fields. You can also select the number of records from Size and sort in the ascending (previous to latest) or descending (latest to previous) order.
Top 10 chains With Successful Result
This widget displays the top ten chains the user has successfully authenticated with. You can edit the widget to customize the display based on the event type.
To edit the widget, click Edit and select the appropriate fields. You can also select the number of records from Size and sort in the ascending (previous to latest) or descending (latest to previous) order.
Top 10 Servers
This widget displays the top ten servers the user has used to authenticate. You can edit the widget to customize the display based on the event type.
To edit the widget, click Edit and select the appropriate fields. You can also select the number of records from Size and sort in the ascending (previous to latest) or descending (latest to previous) order.
Top 10 Tenants
This widget displays the top ten tenants. You can edit the widget to customize the display based on the event type.
To edit the widget, click Edit and select the appropriate fields. You can also select the number of records from Size and sort in the ascending (previous to latest) or descending (latest to previous) order.
Top 10 Repo
This widget displays the top ten repositories. You can edit the widget to customize the display based on the event type.
To edit the widget, click Edit and select the appropriate fields. You can also select the number of records from Size and sort in the ascending (previous to latest) or descending (latest to previous) order.
Top 5 Events for Logons
This widget displays the top five events for login. You can edit the widget to customize the display based on the event type.
To edit the widget, click Edit and select the appropriate fields. You can also select the number of records from Size and sort in the ascending (previous to latest) or descending (latest to previous) order.
Top 5 Users for Logons
This widget displays the top five users for login. You can edit the widget to customize the display based on the event type.
To edit the widget, click Edit and select the appropriate fields. You can also select the number of records from Size and sort in the ascending (previous to latest) or descending (latest to previous) order.
Top 10 Users With Failed Logon
This widget displays the top ten users who have failed in the login attempt. You can edit the widget to customize the display based on the event type.
To edit the widget, click Edit and select the appropriate fields. You can also select the number of records from Size and sort in the ascending (previous to latest) or descending (latest to previous) order.
Top 10 Users
This widget displays the top ten users. You can edit the widget to customize the display based on the event type.
To edit the widget, click Edit and select the appropriate fields. You can also select the number of records from Size and sort in the ascending (previous to latest) or descending (latest to previous) order.
Top 10 Events
This widget displays the top ten events. You can edit the widget to customize the display based on the event type.
To edit the widget, click Edit and select the appropriate fields. You can also select the number of records from Size and sort in the ascending (previous to latest) or descending (latest to previous) order.
Top 10 Methods With Failed Result
This widget displays the top ten methods with failed authentication results. You can edit the widget to customize the display based on the event type.
To edit the widget, click Edit and select the appropriate fields. You can also select the number of records from Size and sort in the ascending (previous to latest) or descending (latest to previous) order.
Disk Usage Per Server
This widget displays information about the percentage of disk usage per time interval. It shows the average disk usage.
You can edit the title and change the time interval to view the records.