18.9 Managing Analytics Dashboard
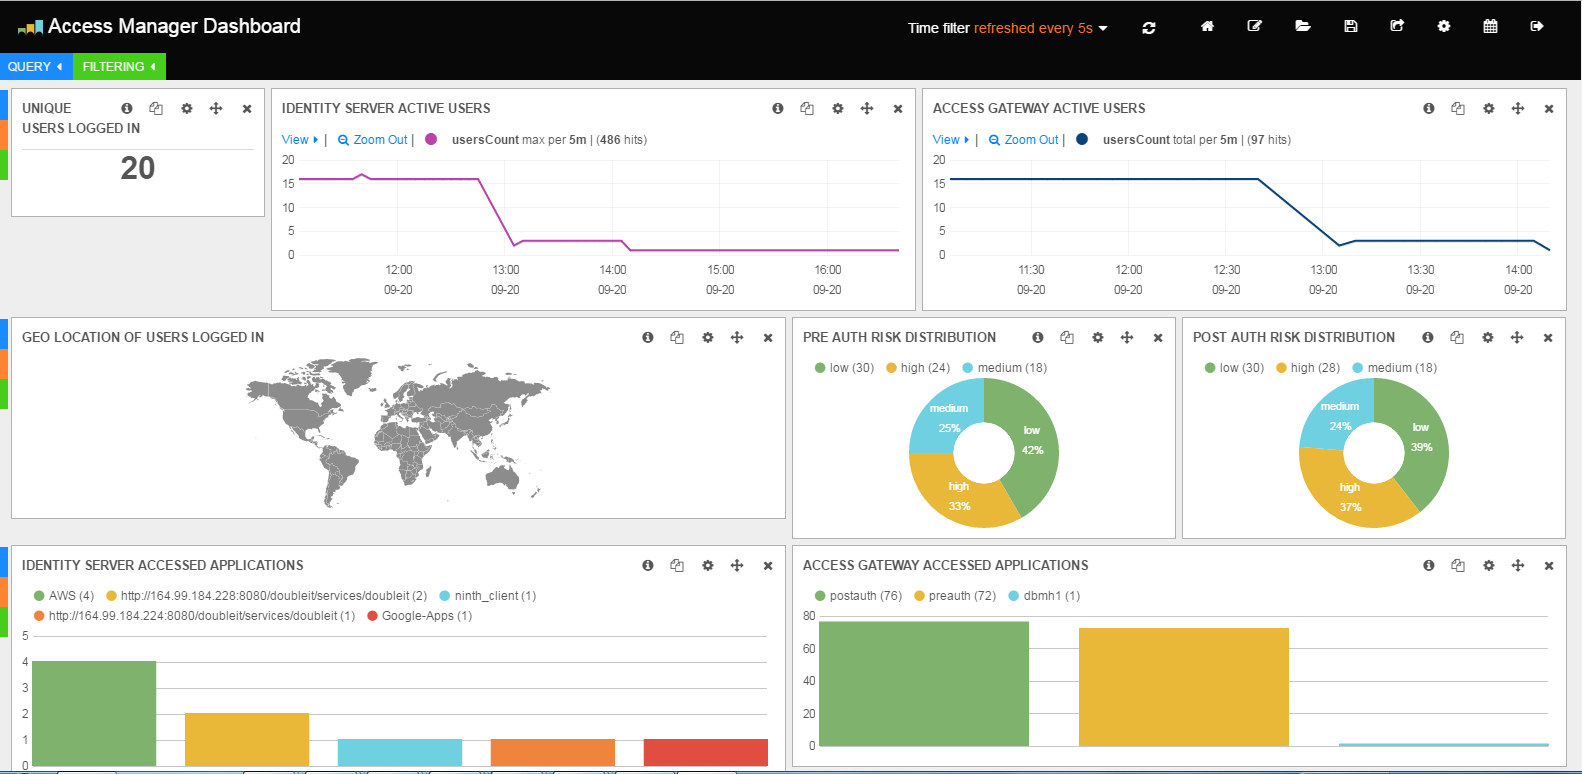
is the default dashboard. You cannot save changes to , but you can modify it and save it with a different name. You can create different dashboards as per your requirements. The points on the line graphs is plotted based on the highest number that is reached in the duration of 5 minutes.
Creating a new graph, or modifying any query is not supported. Hence, you must not modify the default settings of the graphs and dashboard. But, you can perform the following to manage dashboards:
18.9.1 Managing Layout of the Dashboard
You can customize the layout of a dashboard by dragging and dropping required graphs as per your requirements. You can also delete the unused graphs and save the dashboard with the changes.
You can perform the following to save a customized dashboard:
-
(Conditional) If you want to change the positioning of each graph click on the drag icon
 , then move the graphs at the required positions.
-
(Conditional) If you want to remove unused graphs, close each unused graphs.
-
Click the icon.
-
Specify a name for the customized dashboard.
-
Click the icon on the left.
18.9.2 Exporting and Importing a Customized Dashboard
You can export the required customized dashboard to any location on the system, then import it when you require it.
Exporting a Customized Dashboard
-
Log in to Analytics Dashboard
-
Click the Load icon
 , then select the customized dashboard that you require to export
-
Click the Save icon

-
Click >
-
Click > to save the file to the required location
Importing a Customized Dashboard
-
Log in to Analytics Dashboard
-
Click the Load icon
-
Click
-
Click to browse to the correct location, then select the required dashboard file
-
Save the imported dashboard
18.9.4 Managing Dashboard
An administrator can specify any action, which is a query that runs in the back end of the dashboard. You can view or delete the query by using the tab. This section covers the actions that you can perform on Analytics dashboard.
Table 18-1 Managing dashboards
|
Action |
Icon |
Description |
|---|---|---|
|
Goto Saved Default |
|
To load any of the customized dashboards that is saved as the default dashboard. |
|
Load |
|
To search for saved dashboards or remove any dashboard from the list. |
|
Default Dashboard |

|
To load the default Analytics dashboard. You cannot modify/ delete this dashboard, but you can customize this dashboard by saving it with a different name. |
|
Save |
|
To save the customized dashboard. You can also save the dashboard as default by clicking > . |
|
Share |
|
To share the dashboard URL with other administrators. |
|
Configure Dashboard |
|
To modify the dashboard settings as per the requirement. Note: You must not change the default settings of the dashboard because Access Manager does not support Analytics Dashboard with changed settings. |
|
Analytics Scheduler |

|
To generate a report for a specified schedule and to view the graphs when the report is generated. You can also delete the report from scheduler. |
18.9.6 Viewing Historic Data
The Scheduler page helps in generating reports for Analytics Dashboard from the older events that are stored in the Analytics Server database. This report is used only for generating graphs on Analytics Dashboard.
When you require to retrieve data from the database for a specific duration, the scheduler analyses the historic data, then generates a report for Analytics Dashboard.
To create report for historic data, you must use the scheduler page. This page helps with the following:
-
View the details of previously scheduled graphs.
-
Specify the time range, data availability (in days, after which the graphs will be auto deleted) for a new report for Analytics Dashboard.
-
Check the status of the report (scheduled, inprogress, completed).
-
Click on the completed analytic reports to view the graphs.
-
Delete the graphs.
To view the historic data, you must perform the following on Analytics dashboard:
-
Click the scheduler icon
 to view the Analytics Scheduler screen.
-
(Conditional) If you want scheduler to analyze the events that were generated during a specific duration, specify the following under :
-
: Click to select the start and the end date of the historic data.
-
: Click to select the period till when you want the report to be available under the list.
-
-
(Conditional) If you have already scheduled analysis for generating reports, then to view the graphs, click the graph icon next to the report with as under .
It may take some time for the scheduler to retrieve the data and analyze it for generating the report.
NOTE:When you launch a dashboard with the historic data, you must not remove data filters under the tab. If the filter is removed, the graphs will not display the data for the time range that was specified.