Environment
Novell SecureLogin 7.0
Novell SecureLogin 7.0.1
Novell SecureLogin 7.0.2
Novell SecureLogin 7.0.3
NetIQ SecureLogin 8.0
Situation
Random crash in iexplore.exe after installing Novell SecureLogin
Random crash in iesso after installing Novell SecureLogin
Crash in slbroker.exe
SecureLogin crashes
Resolution
First upgrade to the current version of SecureLogin, at least NSL7.0.3. If the problem persists with the current version, follow the directions included in Novell TID 7008895 and disable the dotnet and flash features of SecureLogin as appropriate.
If the crash still occurs then capture a minidump of the crash using either ADPlus or DebugDiag. Steps for capturing a dump with ADPlus are documented in TID 7772679. To capture a dump with DebugDiag, follow the steps below. (Note, this same process should be completed if dotnet or flash support is desired but crashes are seen when one or the other feature is enabled.)
Download the debugging diagnostic tool from Microsoft.
https://www.microsoft.com/en-us/download/details.aspx?id=49924
After installing the debug diagnostic tool then launch the executable debugdiag.exe. Note that the installation also includes an executable named debugdiaganalysisonly.exe. Do not use debugdiaganalysisonly.exe for these steps, we need to use debugdiag.exe to configure the system to capture a memory dump of the issue. It is noted on the Microsoft site that debugdiag was not tested on Vista, Windows 7, etc. and that "analysis only" is what is installed by the MSI package on these platforms. It appears that this is true for the 64 bit version of the tool. If you run into the issue of only being able to see the analysisonly executable then download the 32 bit version to configure the crash rule. Note that debugdiag is not a debugger. The debugger is dbghost and can be configured a number of ways. The use of debugdiag is just one example.
After installing the debug diagnostic tool then launch the executable debugdiag.exe. Note that the installation also includes an executable named debugdiaganalysisonly.exe. Do not use debugdiaganalysisonly.exe for these steps, we need to use debugdiag.exe to configure the system to capture a memory dump of the issue. It is noted on the Microsoft site that debugdiag was not tested on Vista, Windows 7, etc. and that "analysis only" is what is installed by the MSI package on these platforms. It appears that this is true for the 64 bit version of the tool. If you run into the issue of only being able to see the analysisonly executable then download the 32 bit version to configure the crash rule. Note that debugdiag is not a debugger. The debugger is dbghost and can be configured a number of ways. The use of debugdiag is just one example.
When debugdiag is launched you will be presented with a window asking you to specify the rule type. Select Crash.

Click Next >
Now debugdiag needs to know what to trap for... We will select "A specific process"

Click Next >
You now need to select the process that we are going to trap for. Scroll down through the list of running processes and select iexplore.exe. Note that Internet Explorer needs to be running. If you do not see iexplore.exe listed then click the < Back button, launch Internet Explorer, then click the Next > button again.
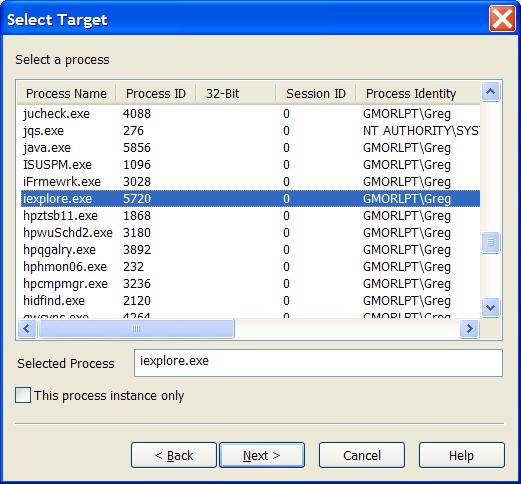
Make sure that you do not check the option "This process instance only". We want to capture the memory dump on any iexplore.exe process, not just the current one we have selected from the task listing. Click the Next > button to continue.
The next window is the Advanced Configuration (Optional) settings. On this page you can configure the maximum number of userdumps created by this rule. The default value is 10 but can be adjusted to meet your disk space needs.
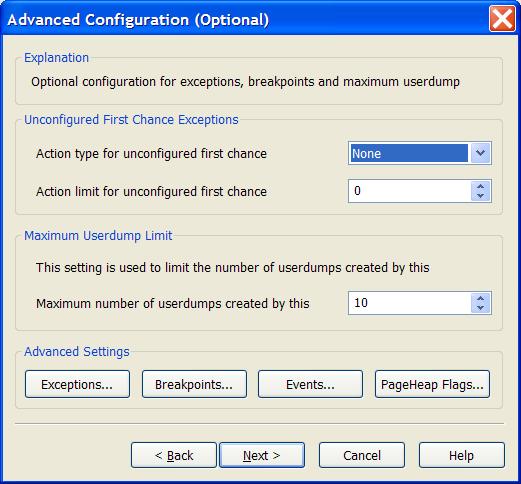
We now need to specify the exceptions to generate the crashdump for. Click the Exceptions button.
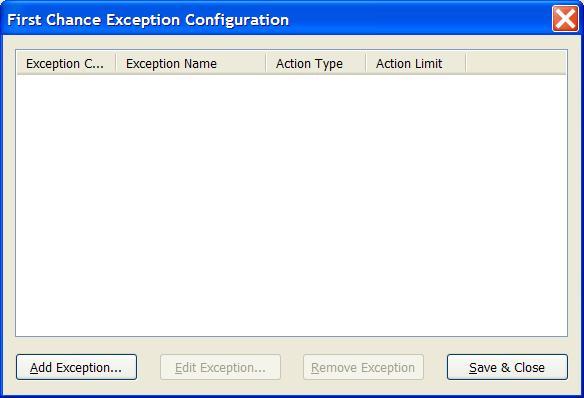
Click the Add Exception button
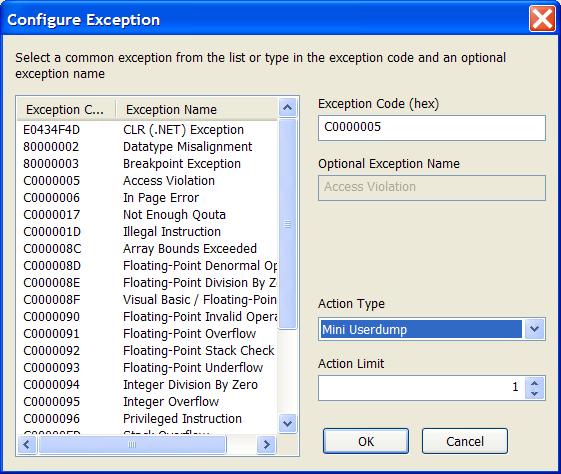
We first select the exception that we will create the userdump for.. This should match the error code seen within the event log. In most cases the exception seen with iexplore.exe will be C0000005 "Access Violation". Make sure that the exception code you want to trap for matches the exception code seen when the crash occurs. This can also be seen under the system event viewer, windows logs, application.
For example
Error Application error
Faulting application iexplore.exe, version 8.0.6001.19088, time stamp 0x4de07b1b, faulting module unknown, version 0.0.0.0, time stamp 0x00000000, exception code 0xc0000005, fault offset....
Set the exception code and then set the Action Type to Mini Userdump, then click the Ok button to return to the previous window.
Click Save and close to save the First Chance Exception Configuration and return to the previous window.
Now click Next >
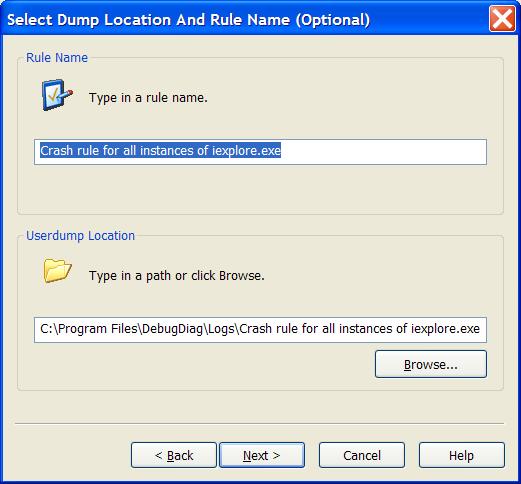
This window allows you to change the location where the memory dump will be created. Also you can change the name of the rule. It is recommended that you leave a descriptive name for the rule. Click Next > to continue.
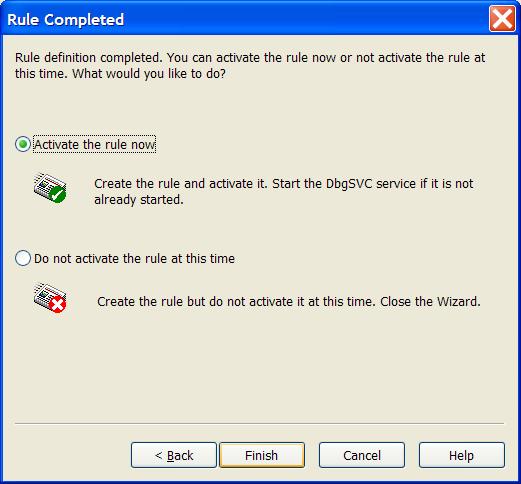
On the Rule completed window leave the default option "Activate the rule now" selected and then click the Finish button.
Now that the rule is defined you should see the rule listed under the Rules tab of the main application window. The crash rule is defined to create a memory dump for any iexplore.exe crash with the exception code of c00000005. The listing will also display the status of "Active" and a Userdump Count of 0. If a crash is encountered after defining this rule then you should see the Userdump Count increment. Once you have acquired a Userdump of the crash then please compress the file with the name of your service request number. Then upload the file to ftp://ftp.novell.com/incoming
Once this process is completed please remember to update the service request to inform the support engineer that the memory dump is available for analysis.