13.3 Troubleshooting Different States
SocialAccess displays indicators for the current state of the different components. The display refreshes every five minutes. SocialAccess might not immediately display the change.
The following sections list the different components, the possible states, and troubleshooting steps to take when the state changes.
13.3.1 Front Panel of the Node
The indicator on the front panel of the node displays the health state of the node.
Figure 13-1 Front Panel
The states are:
Green: The node is healthy.
Yellow: The node cannot communicate with the other nodes within the five minute refresh.
Red: The node cannot communicate with the other nodes within two of the five minute refresh cycles.
Clear: The node is initializing or the state of the node is unknown.
Perform the following troubleshooting steps in the order listed if the state is anything but green:
-
Wait at least five minutes for the display to refresh and display the current state.
-
Click the node, then click .
Show health displays which part of the appliance is having issues.
-
If Show health displays a problem, use the troubleshooting tools to gather logs.
For more information, see Section 13.2, Troubleshooting Tools.
-
Restart the appliance, then wait at least another five minute cycle for all nodes to display the current state.
13.3.2 Top of the Node
The indicator on the top of the node shows whether the commands completed successfully.
Figure 13-2 Top of the Node
The states are:
Green: All commands completed successfully.
Red: The commands did not complete successfully.
Perform the following troubleshooting steps in the order listed if the state is red:
-
Mouse over the top of the node to see the status of the last command made on the node.
-
If there is not enough information in the summary, click on the node, then mouse over the node again.
The troubleshooting mode displays a detailed summary for the last command made on the node.
-
Reboot the appliance, then wait at least another five minute cycle for all nodes to display the current state.
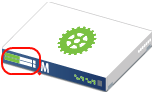
13.3.3 Identity Source
The health indicator for the identity source is the small icon in the lower left corner.
Figure 13-3 Identity Source Indicator

The states are:
Green: The connector to the identity source is healthy.
Yellow: The connector has communication problems with the identity source.
Red: The connector to the identity source is unhealthy or contains errors.
Question mark: The state of the connector to the identity source is unknown.
Perform the following troubleshooting steps in the order listed:
-
If the connector is green, but the SocialAccess console is not displaying users, verify that the identity source servers are running and communicating properly.
-
Use the troubleshooting tools to gather logs, then look at the identity source provisioning logs listed in Table 13-1 for errors. The ConnectorLogs.txt file maps the display name of the connector with the log name of the connector, if there is more than one identity source connector.
-
Click on the master node, then expand .
If these items are yellow or red, the interface displays helpful information to help troubleshoot the issue.
-
If you are using LDAPS to communicate with the identity source, verify the LDAP certificates are not expired. You refresh the certificates as follows:
-
Log in to the administration console, then click on the identity source.
-
Click the icon next to the identity source server.
-
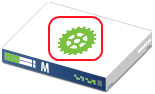
13.3.4 Applications
The health indicator for an application connector is the small icon in the lower left corner.
Figure 13-4 Application Indicator

The states are as follows:
Green: The connector to the application is healthy.
Yellow: The connector to the application contains warnings.
Red: The connector to the application contains errors or cannot communicate with the application.
Question mark: The connector to the application is in an unknown state.
Perform the following troubleshooting steps in the order listed:
-
Click on the master node, then expand , and check the status of .
-
Use the troubleshooting tools to gather logs, then look at the logs listed in Table 13-1 for errors.
-
Make a cosmetic change to the application connector configuration, then click .
By forcing an , the appliance refreshes the application connector state and this can resolve the issue.
13.3.5 Tools
The health indicator for a tool is the small icon in the lower left corner. Only tools that report health have an indicator. The Google Analytics tool does not have a health indicator.
Figure 13-5 Tool Indicator
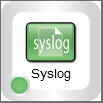
For all tools, the icon indicates that the tool is in an unconfigured state.
Authentication Filter: The states for the Authentication Filter tool are as follows:
-
Green circle: The connection to the destination ExtAPI script is healthy.
-
Red circle: The connection to the destination ExtAPI script is not working. The ExtAPI script is unreachable.
Forward Proxy: The states for the Forward Proxy tool are as follows:
-
Yellow triangle: The connection to or through the proxy is healthy. The triangle indicator serves as a warning that use of Forward Proxy is intended only for test environments.
-
Red circle: The connection to or through the proxy is not working. The proxy device is unreachable.
Google reCAPTCHA: The states for the Google reCAPTCHA tool are as follows:
-
Green circle: All of the configured identity sources are valid for use with reCAPTCHA.
-
Yellow triangle: One or more of the configured identity sources are not valid for use with reCAPTCHA. For more information, see Section 3.6.1, Requirements for reCAPTCHA.
-
Red circle: None of the configured identity sources are valid for use with reCAPTCHA.
Syslog: The states for the Syslog tool are as follows:
-
Green circle: The connection to the specified address:port is healthy.
-
Red circle: The connection to the specified address:port is not working.