14.1 Security Analysts
NOTE:This document assumes your Security Administrator has built the necessary filters and configured Collectors for your system.
14.1.1 Active Views Tab
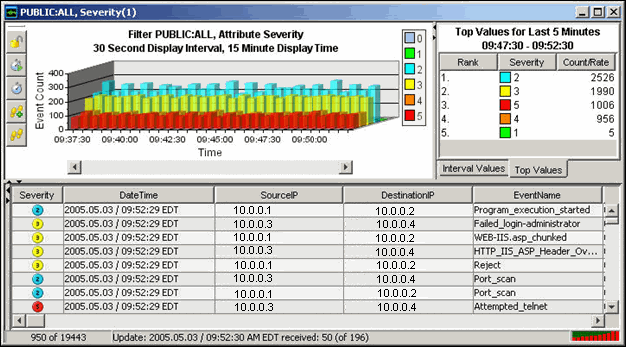
In the Active Views tab, you can monitor events as they happen, performing queries on these events. You can monitor them in a table form or through a 3-D graphical representation.
To get a Real-Time events started:
-
Go to the Active View tab.
-
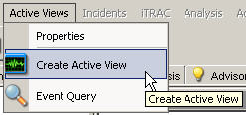
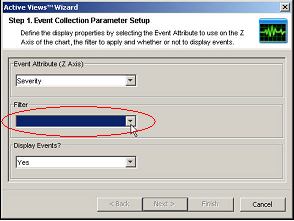
Click Active Views > Create an Active View, select a filter from the Filter drop-down menu and click Select.
-
Click Finish. If you have an active network, you might see something similar to:
NOTE:To display a 3-D graph without real time events, click the Display Events down arrow and select No.
14.1.2 Exploit Detection
For information on how exploit detection works and which Intrusion Detection Systems and Vulnerability Scanners are supported, see Section 8.0, Advisor Usage and Maintenance.
14.1.3 Asset Data
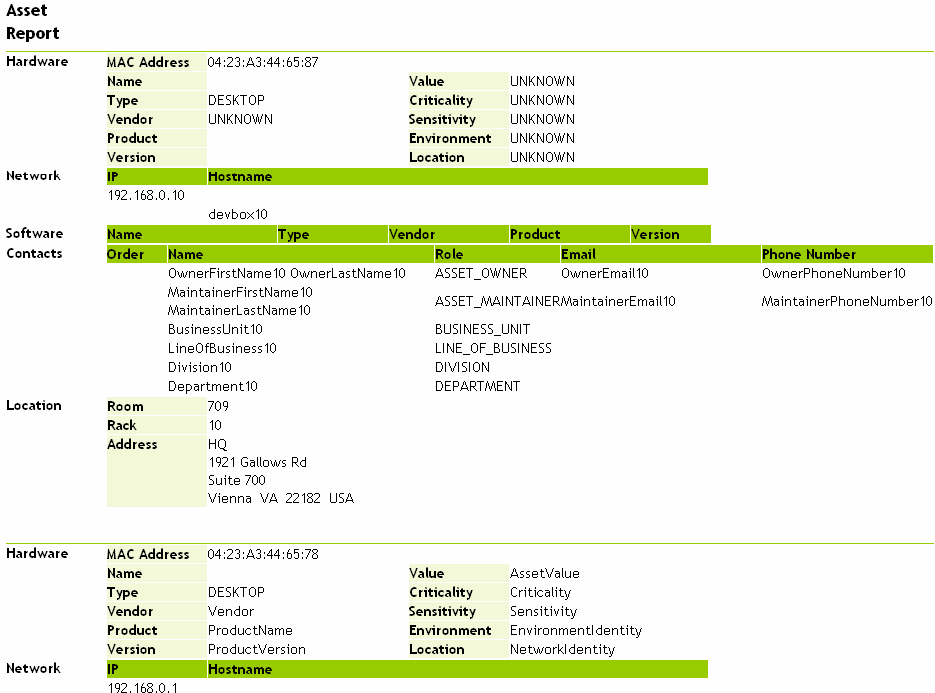
To view Asset information for any event, right-click an event or events > Analysis > Asset Data, a window similar to the one below displays:
Figure 14-1 Asset Report
14.1.4 Event Query
This section talks about event query
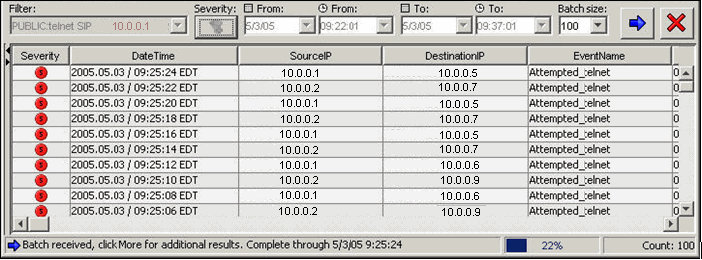
Example Scenario – Telnet Event:
During monitoring, you see numerous telnet attempts from source IP 10.0.0.1 Telnet attempts could be an attack. Telnet potentially allows an attacker to remotely connect to a remote computer as if they were locally connected. This can lead to unauthorized configuration changes, installation of programs, viruses, and so on.
You can Event Query to determine how often this possible attacker has attempted a telnet; you can setup a filter to query for this particular attacker. For example, you know the following:
|
|
To Perform an Event Query:
-
In the Sentinel Control Center, click Event Query (Magnifying Glass icon) and click the Filter drop-down menu.
-
A window with a list of filters displays. Click Add; specify a filter name of telnet SIP 10.0.0.1. In the field below the Filter, specify:
-
Click Save. Highlight your filter and click Select.
-
Provide your time period of interest; click Search (Magnifying Glass icon). The result of your query displays. If your Event Query makes a match, you will get a result similar to the following illustration.
If you want to see how often in general this user is attempting a telnet, remove DestinationIP, SensorType and Severity from your filter or create a new filter. The results will show all the destinationIPs this user is attempting to telnet to.
If any of your events are correlated events, you can right-click > View Trigger Events to find what events triggered that correlated event.
NOTE:Correlated events will have the SensorType column populated with a C.
More Information about Attacks
Another event of interest could be excessive FTP events. This can also be a remote connection, allowing for transferring, copying and deleting of files.
Below is a short list of attacks of interest. Types of attacks are an extensive list. For more information about network/host attacks, there are many resources available (that is, books and the internet) that explain different types of attacks in detail.