11.7 DAS Statistics
This feature is for internal monitoring of your system. It is not intended for the average user. DAS Statistics monitors the following:
-
DAS_Binary
-
DAS_Query
-
DAS_rt
-
Collector_ Manager
-
Correlation _Engine
-
DAS_iTRAC
Statistics are broken down as follows:
-
Service: Name of service such as DAS_Query
-
Time: Time since the last update
-
num: Number of requests processed for this entry
-
WaitTime: Average wait time in seconds for a request before its processing starts
-
Runtime: Average time to process a request (in seconds)
-
#wait: Average size of the wait queue
-
#run: Average size of the run queue
The information is divided into 3 sections:
-
Requests
-
Services
-
ThreadPools
Under Requests it keeps all the requests by channel (such as services.CorrelationService). Under services it does the same by service. Sometimes it provides a breakdown by appending “<category>” under the name, such as Services.CorrelationService or Services.RemoteObjectService.EMap.getMapPK.
Under Services, all the remote method calls from user defined services (your XML services) are all under services.RemoteObjectService. Under that it puts the name of the service (EMap) in the above example and if asked, the name of the method (getMapPK in the above).
When a request is received by a server, such as DAS Query, a task is created and scheduled. The task is then assigned to a thread pool for execution. There can be more than one thread pool and a thread pool can service multiple services. For that reason, a request needs to wait for an available thread even if the service is not heavily used. If the statistics indicate that the wait time for a request is large and the number of requests for that service is low, check the information about the thread pools.
The numbers next to an entry are the sum for all its children. So requests 15 means that there are 15 requests for all requests method calls. Under that, requests.configurations 1 means that 1 of the 15 are to configurations, requests.esecurity.correlation.config 2 means that 2 of the 15 are to esecurity.correlation.config and so on.
Figure 11-9 Das Statistics window
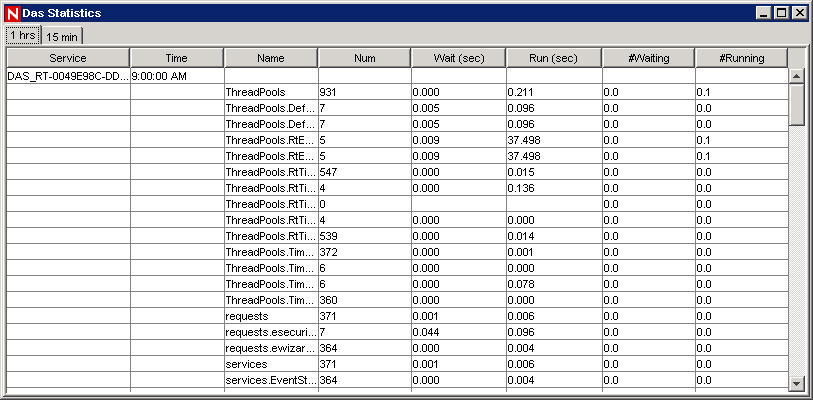
The information can be useful because it shows what is going on. The number of requests is especially useful, you can see where they are all going or concentrated. The #waiting is useful because it shows how busy the server is. That number should be small. If it is large, new requests (even for simple tasks) will need to wait for potentially slow ones. This is not a good situation. The average run time is very important because it shows which requests are actually taking all the time, as opposed to waiting for others.