10.3 Live View
The ESM panel provides the main user interface to Event Source Management. You can view configuration data in Graphical or Tabular view.
10.3.1 Graphical ESM View
The Graphical view of ESM is the default view in Event Source Management. In Graphical view, you can view the status of a Collector and access the configuration settings of Collectors and Collector related objects as a graph of connected nodes.
Figure 10-11 Graphical View

By default, the Health Monitor Display frame displays in the Graphical View. The data can be displayed in seven different layouts. The default layout in graph is the “Hierarchic Left to Right” layout. You can change between these layouts by selecting the layout format from the drop-down list in the Tool Bar.
Figure 10-12 Layout Selection

HINT:Click in the Graphical ESM view and use “+” or “-”sign to zoom in or zoom out. Alternatively use mouse wheel to zoom in and zoom out.
In the Graphical View, the lines connecting the components are color-coded to indicate data flow.
-
Green Line: Indicates data is flowing between the components.
-
Grey Line: Indicates the connection is not live and there is no data flow.
-
Blue dashed Line: Indicates the logical relation of Event Source Servers to their associated Collector Managers and Event Sources.
The terminology used for nodes are:
-
Parent Node: A Node from which child nodes originate
-
Immediate Children: The sub nodes that are logically and functionally linked to a Parent Node.
-
Collapsed/Expanded nodes: To improve the manageability and performance of the Graphical display, Sentinel automatically contracts any node with 20 or more immediate children. This is especially useful for Connectors such as Syslog or Novell Audit that have the ability to automatically configure a large number of event sources.
HINT:Collapsed Nodes are identified by a “-” sign on the node and Expanded Nodes by “+” sign.
Double-click a node to expand or collapse.
In collapsed state, a node displays the number of immediate children next to the node; for example, WMI Connector (3) [Collector name (Number of immediate children)]. The “Children” panel of a contracted node shows the immediate children of that node, each of which can be managed in the same way as nodes in the Tabular ESM View.
NOTE:Event Source Server node do not have “+” or “-” sign after its name even if it contains children.
Double-clicking a parent node changes the state from collapsed to expanded and vice versa. Double-clicking a node with no children displays the status details for that node. If an additional node is added to an expanded parent with over 20 children the node is contracted automatically. If an additional node is added to a manually expanded parent with over 20 children the node will not be contracted automatically.
The parent node can take several minutes to expand if the parent node has a large enough number of child nodes to potentially cause the UI to become unresponsive; an alert message displays on the user interface to warn you about the delay in response. Click Yes to continue.
Figure 10-13 Expand Selected Node prompt
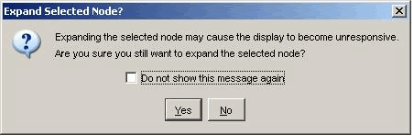
If you chose not to show this message again, the preferences are saved on that machine and any user logging into Sentinel from that machine will not get an alert again.
10.3.2 Tabular ESM View
The components visible in the Graphical view of ESM can also be viewed in tabular format. In Tabular view, you can view the status of a Collector in a table and access the configuration settings of Collectors and Collector related objects.
Figure 10-14 Tabular View

The columns in the ESM Tabular View are:
-
Configured Status: The On state the object is configured to be in. This is the state that is stored in the database and do not necessarily match the actual On state of the object. For example, the two states will not match if a parent object is turned off or if there is an error.
-
Actual Status: The On state of the object as being reported by the actual running Collector Manager.
-
Connection Info (populated for Event Sources only): A textual description of the Event Source connection.
-
Error: A textual description of an error that occurred in the running object.
HINT:Use the Table/Graph tabs to change to Tabular/Graphical views.
10.3.3 Right-Click Menu
The Health Monitor Display View provides a set of right-click menus that helps you execute a set of actions, as described below:
NOTE:The right-click actions available depend on the kind of object you clicked on.
-
Status Details: You can view all information known about the status of the selected object.
-
Start: You can set the object to be running.
NOTE:The selected object will only start after the parent nodes starts and its running.
-
Stop: You can stop the running object.
-
Edit: You can modify the editable information (Filter information, Object name and so on) with this option.
-
Debug: You can debug the Collector. You must stop the running Collector before you debug it.
-
Move: You can move the selected object from its current parent object to another parent object. You can move objects between the views that is live view to scratchpad and vice versa.
-
Clone: You can create a new object that has its configuration information pre-populated with the settings of the currently selected object. This allows you to quickly create a large number of similar Event Sources without having to retype in the same information over and over again. You can clone objects between the views that is live view to scratchpad and vice versa. Cloning an object Copies all the settings except the “Run” status. New objects created using the Clone command will always be in the Stopped state after creation.
-
Remove: You can delete a selected object from the system.
-
Contract: Contract the child nodes into this node. This option is only available on parent nodes that are currently in an expanded state.
-
Expand: Expand the child nodes of this node. This option is only available on parent nodes that are currently in a contracted state.
-
Add Collector: It allows you to open an Add Collector wizard that guides you through the process of adding a Collector to the selected Collector Manager.
-
Add Connector: It allows you to open an Add Connector wizard that guides you through the process of adding a Connector to the selected Collector.
-
: It allows you to open an Add Event Source wizard that guides you through the process of adding an event source to the selected Connector.
-
Open Raw Data Tap: You can view the live stream of raw data from an Event Source or flowing through the selected object.
-
Open Active View: You can open Active View window that only displays events that have been generated by data from or flowing through the selected object.
-
Zoom: You can zoom in the graphical view display on the selected object.
-
Show in Tabular/Graphical View: You can switch over to the other view (to tabular view if on graphical view, or to graphical view if on tabular view) and automatically selects the object that is selected in the current view. When switching to graphical view, it also zooms in on the selected object.
-
Raw Data Filter: It allows you to filter the raw data flowing through the selected node. The raw data filter is available on Collectors, Connectors, and Event Sources. If a filter is specified to drop data, the data to be dropped will not be passed to the parent node and, therefore, will not be converted into events.
-
Import Configuration: You can import the configuration of ESM objects.
-
Export Configuration: You can export the configuration of ESM objects
-
Add Event Source Server : It allows you to add Event Source Server to the selected Collector Manager
-
Add Collector Manager: In Scratchpad mode, you can add a Collector Manager to the scratchpad by using this option. In the Live view, Collector Manager objects are created automatically as each Collector Manager connects to the Sentinel system.
When you select multiple objects in the ESM panel and right click. The following options are available:
-
Start: To start all the objects
-
Stop: To stop all the objects
-
Remove selected objects: To remove the selected objects along with its children
HINT:Press “Shift” and click the object to select multiple objects.