2.12 Viewing Vulnerabilities
Vulnerability Visualization provides a textual or graphical representation of the vulnerabilities of selected destination systems. Vulnerabilities for the selected destination IPs can be seen for the current time or for the time of the selected events.
Vulnerability Visualization requires that a vulnerability Collector is running and adding vulnerability scan information to the Sentinel database. The Sentinel Collectors Web site provides Collectors for several industry-standard vulnerability scanners, and additional vulnerability Collectors can be written using Collector Builder.
NOTE:Vulnerability Collectors are distinct from Event Collectors and use different commands.
There are several Vulnerability Visualization views:
-
HTML
-
Graphical
-
Circular
-
Organic
-
Hierarchical
-
Orthogonal
-
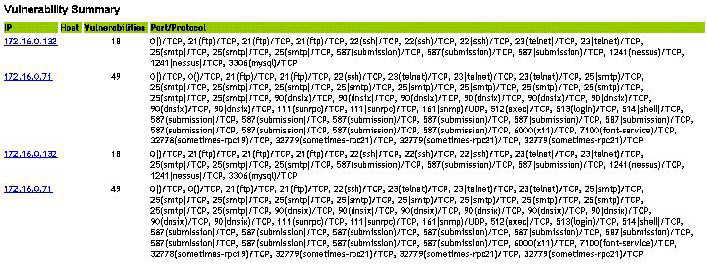
The HTML view is a report view that lists relevant fields, depending on which vulnerability scanner you have:
-
IP
-
Host
-
Vulnerability
-
Port/protocol
Figure 2-6 Viewing Vulnerability
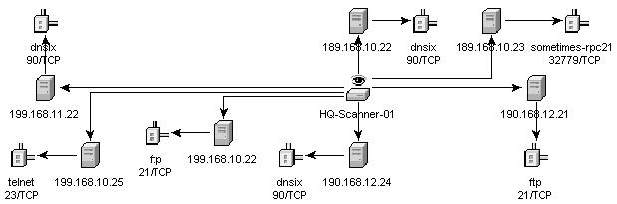
The graphical display is a rendering of vulnerabilities that link them to an event through common ports. Below are the examples of the four available views:
Figure 2-7 Organic View
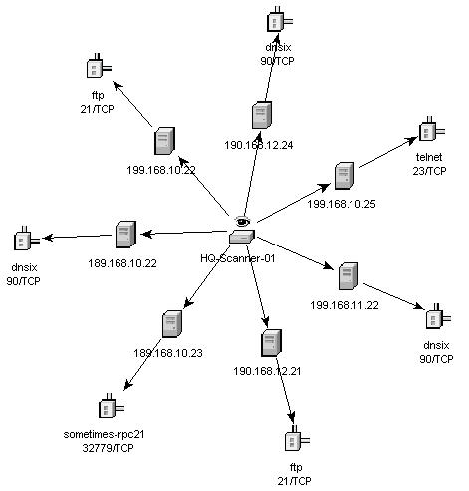
Figure 2-8 Hierarchical View
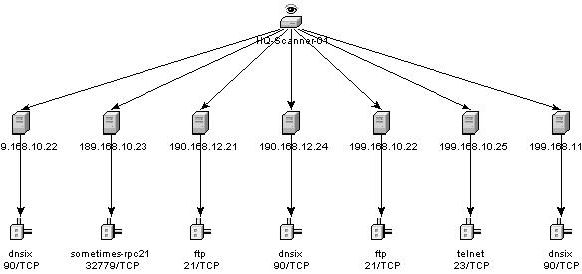
Figure 2-9 Circular View
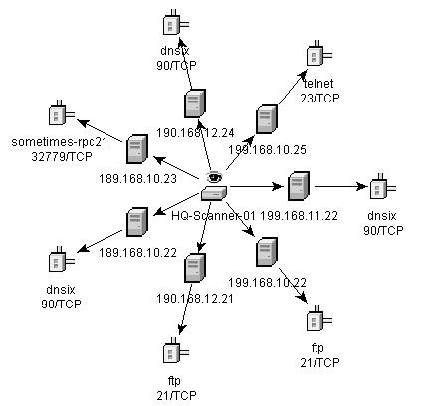
Figure 2-10 Orthogonal View
In the graphical display there are four panels. They are:
-
Graph panel
-
Tree panel
-
Control panel
-
Details/events panel
The graph panel display associates vulnerabilities to a port/protocol combination of a resource (IP address). For example, if a resource has five unique port/protocol combinations that are vulnerable, there are five nodes attached to that resource. The resources are grouped together under the scanner that scanned the resources and reported the vulnerabilities. If two different scanners are used (ISS and Nessus), there are two independent scanner nodes that will have vulnerabilities associated with them.
NOTE:Event mapping takes place only between the selected events and the vulnerability data returned.
The tree panel organizes data in same hierarchy as the graph. The tree panel also allows users to hide/show nodes at any level in the hierarchy.
The control panel exposes all the functionality available in the display. This includes:
-
Four different algorithms to display
-
Ability to show all or selected nodes which have events mapped to them
-
Zooming in and out of selected areas of the graph
There are two tabs in the Details/Events panel. When in the Details tab, clicking on a node results in displaying node details. When in the Events tab, clicking on an event associated with a node the node displays in tabular form as in a Real Time or Event Query window.
To run a Vulnerability Visualization:
-
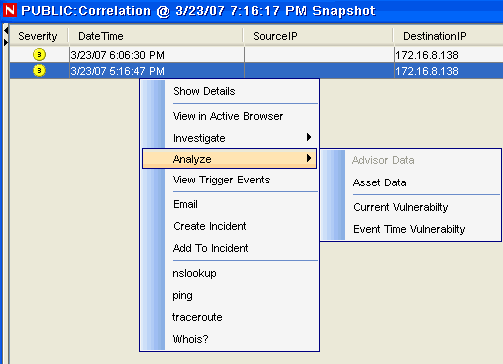
In an Real Time Event Table of the Navigator or Snapshot, right-click an event or a series of selected events and click:
-
Analysis:
-
Current Vulnerability: Queries the database for vulnerabilities that are active (effective) at the current date and time.
-
Event Time Vulnerability: Queries the database for vulnerabilities that were active (effective) at the date and time of the selected event.
-
-
-
At the bottom the vulnerability results window, click either:
-
Event to Vulnerability Graph
-
Vulnerability Report
-
-
(For Event to Vulnerability Graph) Within the display, you can:
-
move nodes and their labels
-
use one of four different layout algorithms to display the graph
-
show all nodes or only those nodes that have events mapped to them
-
in-line tree filtering in the event that a large number of resources are returned as vulnerable
-
zoom in and out of selected areas
-