2.9 Investigating an Event or Events
This Investigate options on the Event Menu allow you to:
-
Perform a Event Query for the last hour on a single event for:
-
Other events with the same target IP address
-
Other events with the same source (initiator) IP address
-
Other targets with the same event name
NOTE:You cannot perform a query on a null (empty) field.
-
-
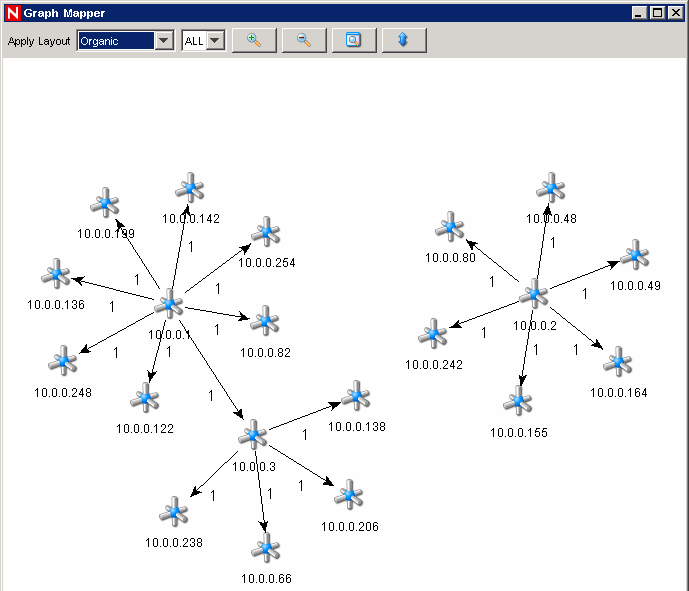
Graphically display the mappings between any two fields in the selected events. This is particularly useful to view the relationship between the initiatiors (IP, port, event, sensor type, Collector) and the targets (IP, port, event, sensor type, Collector name) of the selected events, but any fields can be used
Below is an illustration of initiator IP addresses mapped to target IP addresses.
Figure 2-5 Graph Mapper
2.9.1 Investigate – Event Query
This function allows you to perform Event Query within the last hour for events similar to the selected event.
To perform an Event Query using the Investigate function:
-
In a Navigator or Snapshot window, right-click an event>Investigate> <select one of three options below>
-
An event table opens showing the chosen event information.
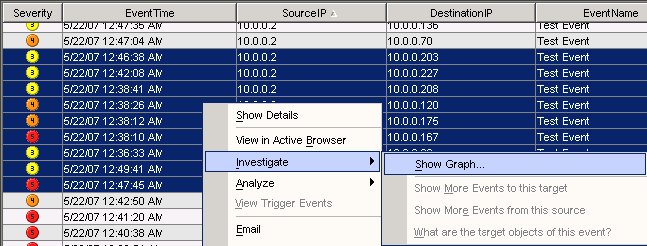
2.9.2 Investigate – Graph Mapper
To create a graph map:
-
In Real Time Event Table right-click an event or events and select Investigate>Show Graph.
-
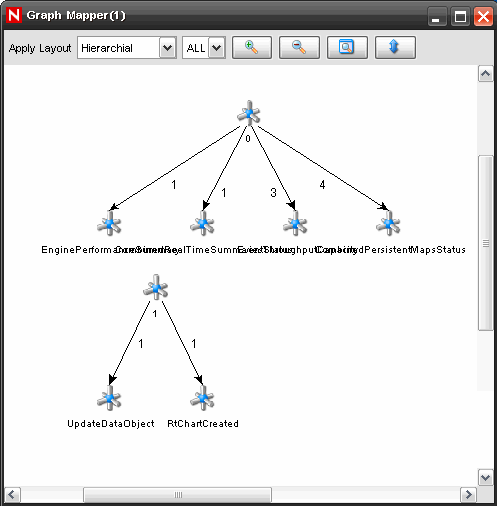
You must specify the From and To fields and click Finish. The Graph Mapper window displays.
The following is a graphic depiction of Sensor Name to Event Name of severity 5 in an organic format. You can view a graphic mapping in the following formats:
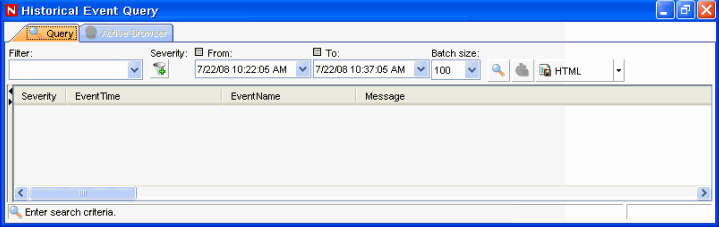
2.9.3 Historical Event Query
You can query the database for the past events through Historical Event Query. The events can be queried according to the filter and severity criteria in required batch size. You can export the results in HTML or CSV file format.
To query events in Historical Event Query window:
-
In the Active Views tab, select Active Views > Event Query. You can also open Historical Event Query window by clicking Historical Query Icon on the toolbar. The Historical Event Query window displays.
-
Click Filter. In Filter Selection window, select a filter from the list of available filters.
-
Click Severity Icon. Select Severity values window displays.
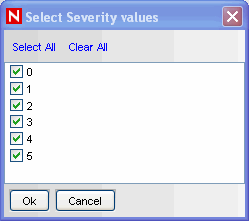
Select one or more values for Severity and click OK
-
You must select From and To Date and Time from From and To drop-down. The Time you select corresponds your system time.
-
Select a batch size from the Batch size drop down. The events queried displays in the batch size you specify.
If you select a batch size of 100, the first 100 events are displayed in the window first. After the query is processed, the Begin Searching icon changes to More results icon. You can see next 100 events along with the previous events by clicking More results icon.
-
Click Begin Searching Icon. The query is processed. You can stop/cancel the search by clicking Cancel search icon.
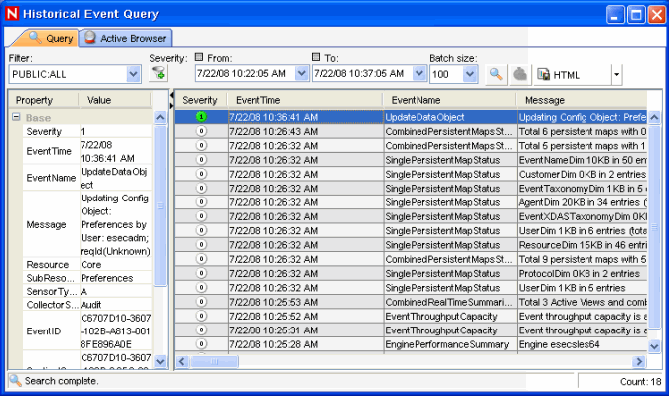
HINT:Select HTML or CSV from the drop-down list to export query results.
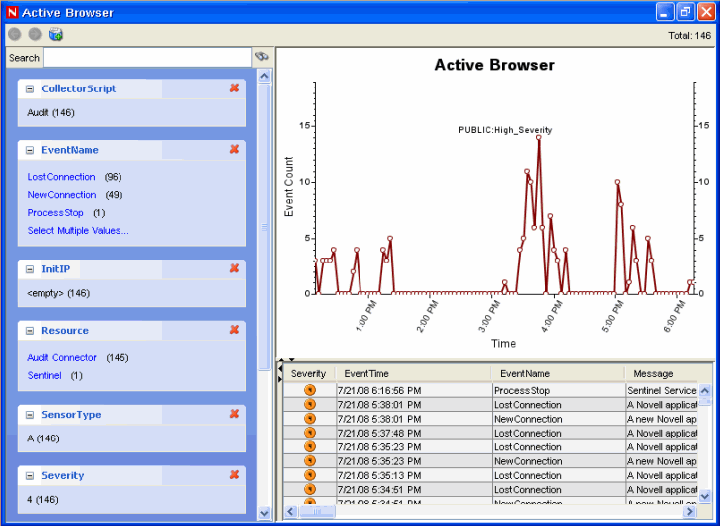
2.9.4 Active Browser
The Active Browser provides the ability to browse through a selected set of data to look for patterns and perform investigation. You can view the selected events in the Active Views in Active Browser. You can perform all the right-click activities that are available in Active Views in Active Browser too. When you open the Active Browser using Analysis > Offline Query and click Browse against a specific offline query, the events table is displayed only when the number of events are less than or equal to1000.
The events are grouped according to the metatags. In these metatags various sub-categories are defined. The numbers in the parentheses against these sub-categories displays the total number of event counts corresponding to the value of the metatag.
To view events in Active Browser:
-
In the Active Views tab, highlight the event/s you want to view in Active Browser.
-
Right-click event/s and select View in Active Browser. The selected event/s displays in the Active Browser window.
Or
-
In the Active Views tab, select Active Views > Event Query. Historical Event Query window displays.
-
In the Historical EventQuery window, run a Query and click Active Browser tab. The selected Query displays in the Active Browser window.
NOTE:The Active Browser tab will be enabled only if the Query results in at least one event displays.
To view events in Active Browser in Analysis tab:
-
In the Analysis tab, highlight the Query you want to view in Active Browser.
-
Click Browse. The selected Query result displays in the Active Browser window.
To search in Active Browser:
-
Specify the value or text you want to search for in the Search field
-
Press Enter or click the Search icon against the search field to search.
NOTE:You can move between the various searches by using the Forward and Backward button above the search field.
To add attributes in Active Browser:
-
Click Add an attribute for categorization icon as shown below:
-
Select an attribute in the Add an attribute for categorization window that displays.
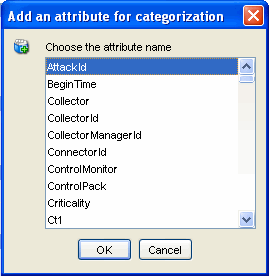
-
Click OK.