2.4 Viewing Real Time Events
To View Real Time Events:
-
Click the Active Views tab.
-
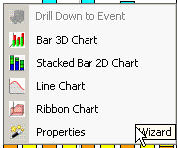
Click Active Views > Create Active View or click Create Active View icon.

-
In the Event Visualization Wizard window, click the down arrows to select your Event Attribute (Z Axis), Filter and to Display Events (Yes or No).
NOTE:In the Filter Selection window you can build your own filter or select one of the already built filters. Selecting the All filter allows all events to display in your window. When creating an Active View, if the filter assigned to the Active View is changed or deleted after creation of the Active View, the Active View is unaffected.
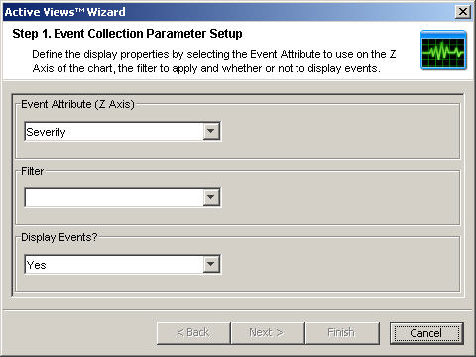
After making your selection, you can click Next or Finish. If you select Finish, the following default values are selected:
-
Display Interval and Refresh rate of 30 seconds
-
Total Display Time of 15 minutes
-
Y-axis as Event Count
-
Chart type: Stacked Bar 2D
-
-
If you click Next, click the down arrows to select your:
-
Display Interval and Refresh rate:
-
Display Interval is the Time interval to display events.
-
Refresh Rate is the rate at which Active Views should refresh.
-
-
Total Display Time: Amount of time to display the chart
-
Y-axis: Either total Event Count or Event Count per Second
Click Next.
-
-
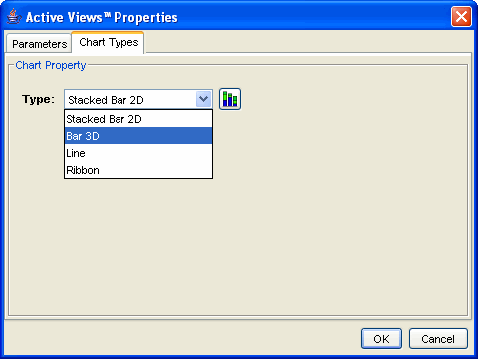
Select your chart type from the drop-down list and click Finish.
-
Chart type: Stacked Bar 2D, Bar 3D, Line and Ribbon
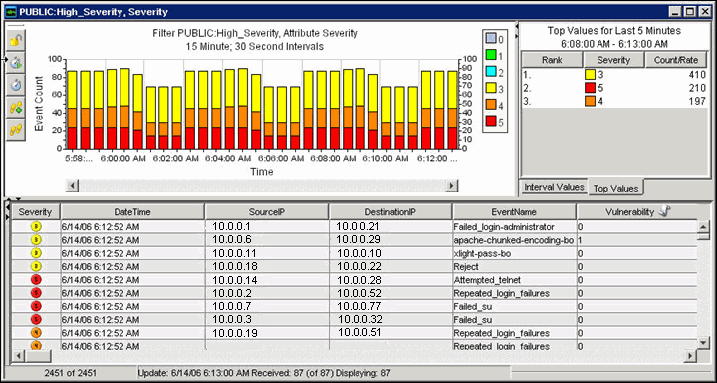
Your graph looks similar to:
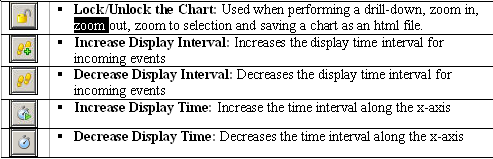
The five buttons to the left of the chart perform the following functions:
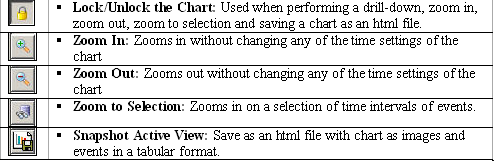
When you click the Lock button, additional available buttons are:
-
2.4.1 To Reset Parameters and Chart Type of an Active View
When viewing an Active View, you can reset your chart parameters, change your chart type.
To Reset Parameters and Chart Type of an Active View:
-
Within an Active View displaying a chart, right-click and select Properties.
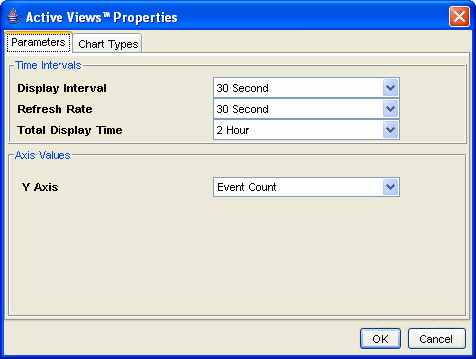
Under the Parameters tab, you can set:
-
Display Interval: Time between each interval
-
Refresh Rate: Number of seconds for event rate to be updated
-
Total Display Time: Amount of time to display the chart
-
Y-axis: Either total Event Count or Event Count per Second
Under the Chart Types tab, you can set your chart to Stacked Bar2D, Bar 3D, Line or Ribbon.
-
2.4.2 Rotating a 3D Bar or Ribbon Chart
To rotate a 3D bar or ribbon chart:
-
Click anywhere on the chart and hold the mouse button.
-
Reposition the chart as desired by moving the mouse and holding the button.