14.1 Using the Dashboard
PlateSpin Transformation Manager provides the ability to view summary metrics for your transformation project in the Dashboard.
-
Shows users metrics only for their assigned projects, waves, or batches.
-
Shows the progress of projects, waves, and batches.
-
Shows metrics for workloads by state, operating system, and transformation method.
-
Runs status and count calculation jobs every 5 minutes. Displays if workload changes occur while the calculation jobs run.
14.1.1 About the Dashboard
The PlateSpin Transformation Manager Dashboard displays statistics about your assigned transformation projects, waves, or batches. The
Figure 14-1 Project View of the Dashboard
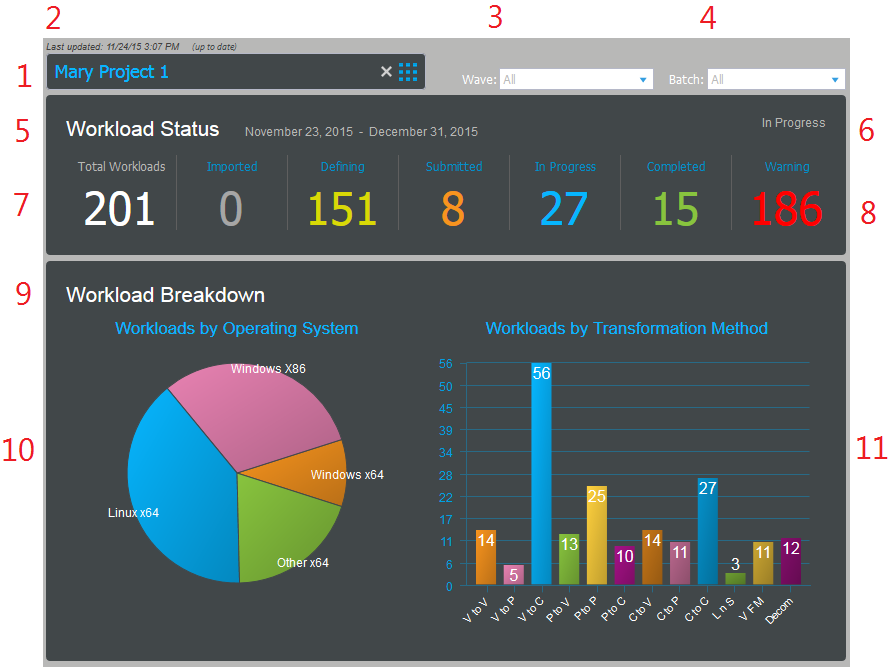
Table 14-1 Dashboard Information
|
Key |
Metric |
Description |
|---|---|---|
|
|
Project |
If you have roles on multiple projects, the Project field allows you select which project’s information to display. If you have a role on a single project, the Project field and Project Selector settings are static. |
|
|
Last Updated |
The PTM Server compiles status and counts for each project every 5 minutes. This time stamp tells you how current are the displayed statistics. If changes occur while you view the dashboard, it also displays the Needs update message. If no changes have occurred, it displays the Up to date message. |
|
|
Waves |
If a project has multiple waves, the Waves field allows you to select which wave’s information to display. The default is all waves. |
|
|
Batches |
If a project has multiple batches, the Batches field allows you to select which batch’s information to display. The default is all batches. |
|
|
Schedule |
At the top of the Workload Status pane, PTM displays the start date and cutover date of the project, wave, or batch currently being displayed. |
|
|
Project Status |
The current state of the project. For example: In Progress, Closed |
|
|
Transformation Status |
The total number of workloads for the project, wave, or batch currently being displayed, and the counts for workloads by category: Total Workloads, Imported, Defining, Submitted, In Progress, Completed, Warning. Click the category title or value to open a Workloads list with the appropriate member items. You can alternatively use the > option on the Advanced Search dialog to see all workloads in the Warning state. |
|
|
Warning |
The count includes any workload transformation that has one or more of the following conditions:
|
|
|
Workload Breakdown |
The graphical presentation of workloads based on workload characteristics. |
|
|
Workloads by Operating System |
A pie chart showing the percentage of workloads for the project, wave, or batch currently being displayed in each of the operating system categories. This breakout depends on the mix of operating systems allocated in the parent schedule container. |
|
|
Workloads by Transformation Method |
A bar chart showing the count of workloads for the project, wave, or batch currently being displayed in the transformation method categories:
|