2.10 Diagnosing Memory Errors
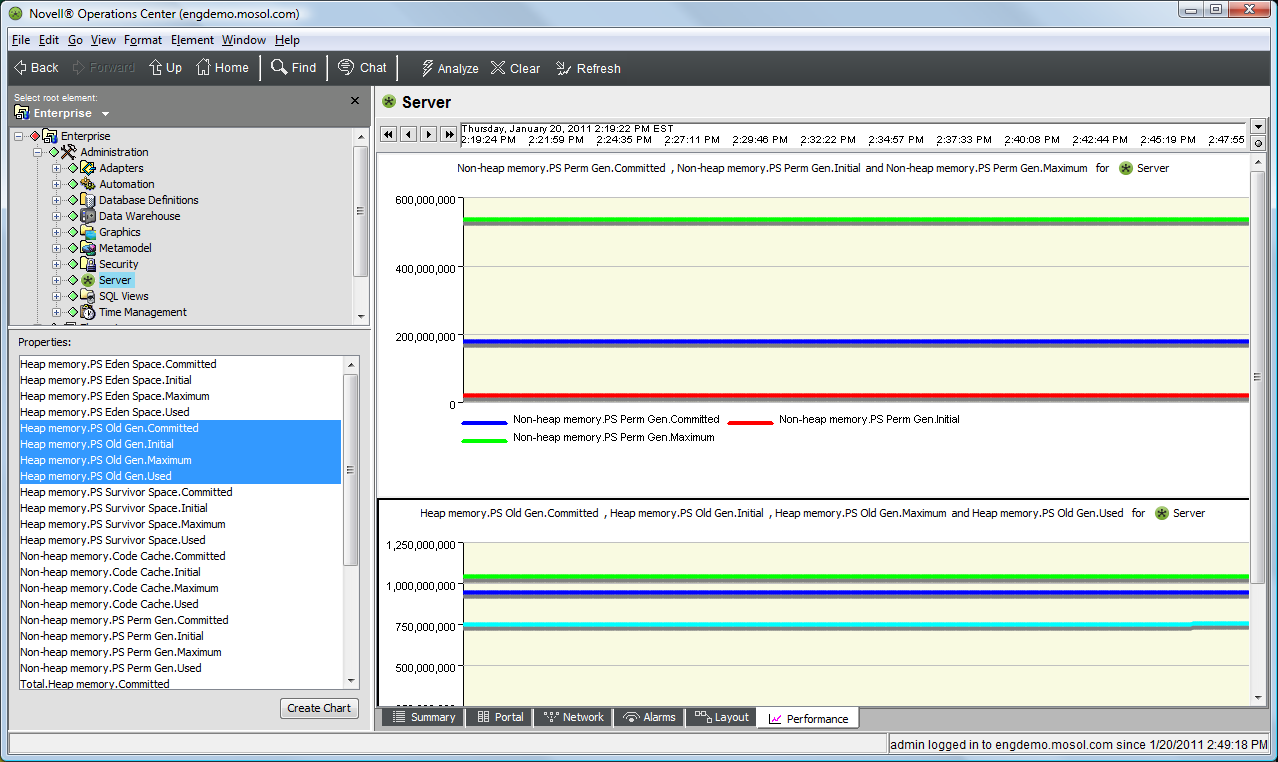
By default, the Operations Center server saves data related to various garbage collection and memory activities that can help when diagnosing memory errors. The actual properties can vary, depending on the virtual machine running.
To chart server memory statistics:
-
In the Explorer pane, expand the Administration root element > Server.
-
Click the Performance tab to display the Performance view.

-
Adjust the timeline to select the desired time range.
-
Select the memory properties in the Properties pane.
-
Select all four Old Generation properties.
-
Click Create Chart.
-
Select all four Perm Generation properties.
-
Click Create Chart.
This creates a single view of the two most important memory charts related to the Operations Center virtual machine. Take a screen shot of these charts and include it with the memorysamples.dat and fsgc.log files from the Operations Center log directories when working with Technical Support on memory issues.