9.4 Using the Performance Portlet in the Dashboard
The Performance portlet in the Operations Center dashboard can create a chart to show alarm severity counts or child condition counts on a chart.
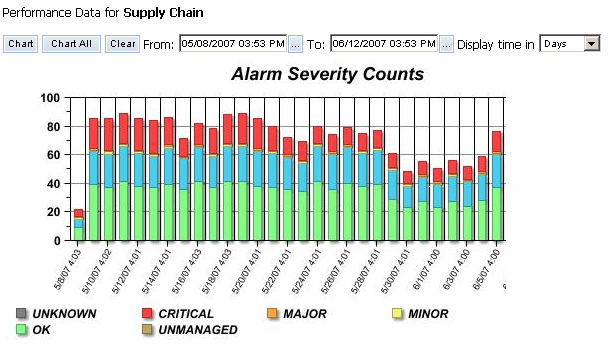
Figure 9-7 Performance Component Showing Alarm Severity Counts
To create a chart to show alarm severity counts or child condition counts on a chart in the Dashboard:
-
Select either or , or both.
If the data is incompatible, nothing displays on the chart.
-
To display the time (minutes, hours, days, weeks, months, or years), select the time period to chart.
For each time period, there is a maximum amount of data that can be displayed.
For more information see the Operations Center 5.6 Dashboard Guide.