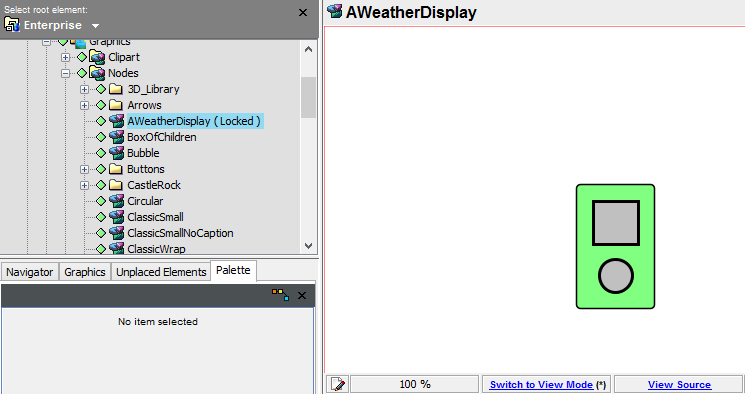
6.7 Stacked Container Example: Toggling Graphics Based on Condition State
In this example, we’ll create a node style that displays a different graphic matching the condition state of an element. When the element’s condition updates, the node will show an appropriate weather graphic overlaid on a condition color-filled background. For example,

OK |

MAJOR |

CRITICAL |
For more information on the clip art and graphics library, see Section 4.0, Working with Clip Art and Graphics. For an additional example, that includes looking at the source code bind language, see and Section C.4, Looking at the Source Code with a Toggling Graphic Node Style Example.
To create a stacked node style:
-
In the pane, expand > > to display a list of existing node styles.
-
Right-click , and select .
-
Select your new node style and open the view.
-
Right-click the background of the Layout View, and select . All elements are removed leaving the Layout view empty and using Edit Mode.
-
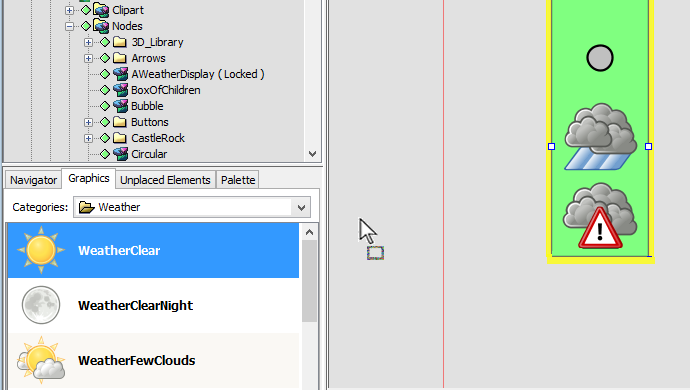
Right-click the Layout View, and select > > > . A container displays showing two placeholder elements:
-
Right-click the container (green rectangle object), and select .
-
Add all the graphic files that you would like to display for condition changes.
-
Open the tab in the left pane and select the desired category.
-
Click and drag any of the graphics to anywhere on the background of the Layout view. One by one they are automatically added to the container. The order that you add them is not important.
-
Click the default shapes or any unwanted objects in the container and delete them.
-
-
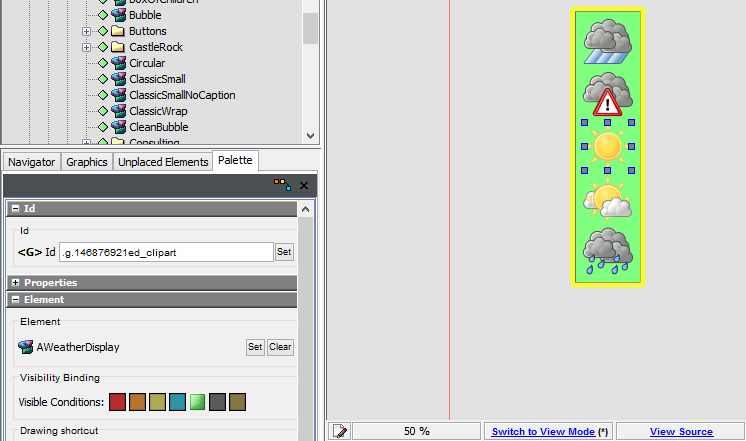
Associate the graphics to condition levels.
-
Click to select the clipart object you want to assign.
-
Open the tab and select the condition states ( settings under ) that must be present for this object to display. Click to enable or disable conditions. In this example, the sun displays only for OK condition values.
-
Repeat these steps for each graphic or object in the container.
-
-
Right-click the container and select .
-
To test the node style, click and select an element in or .
In this example, we selected an element with a CRITICAL condition. Only the graphic displays with the condition filled background. As expected, all other graphics are hidden for this state.
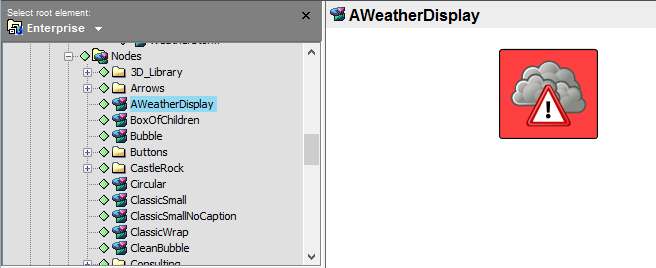
Be sure to test or double-check values for each condition state so that you know the behavior of the node style functions the way you’d like. One way to test is to apply the nodestyle to a branch of your hierarchy that has elements representing all condition states.
-
and save the node style.
-
Later, to make changes to the node style, do the following:
-
In Edit Mode, right-click the container, and select .
-
Make the desired changes.
-
When you are finished, right-click the container, and select .
-
Return to View Mode and save the changes.
-