8.12 Configuring the Show Impacted Portlet
The Show Impacted portlet shows the elements that are affected by the current state of the selected element in both a summary view and a detailed view.
The Show Impacted portlet is also available as a view from other Operations Center portlets including Alarms, Summary, Layout, Tree Map, Element Properties, Properties Table, Root Cause, Chart Builder, Performance and Summary. Click and select > from any of these portlets.
Figure 8-14 Show Impacted Portlet Displaying Impacted Component with Display Notes Selected
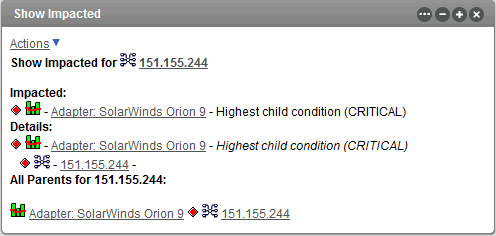
Element state is indicated by a status icon, the color of which corresponds to the element’s current condition that is mapped to colors in the Operations Center server. For more information about element condition settings, see the Managing Condition/Severity Colors in the Novell Operations Center 5.0 User Guide.
Element details can vary by the type of element and the alarms associated with it. Details, which is a configuration turned off by default, can include the highest child condition, the highest alarm severity, the number of active alarms, the number of active critical alarms, and so on.
To configure the Impacted portlet/view:
-
Click
 and select
  .
.
-
Click the tab.
For portlets other than Show Impacted, the tab is found under the tab.
-
Select the check box to display more details for each element.
-
Click .