4.2 Managing Trend Analysis
The LDAP Trend Manager is an advanced LDAP event trend analysis tool that allows you to analyze the trend log files through a graphical representation. You can generate a graphical view of each server activity based on different time interval and LDAP events.
-
Run the ./NLPManager command to start the NLPManager.
The LDAP Proxy window is displayed.
-
Do one of the following:
-
Click the
 icon.
icon. -
In the menu, click .
The tab is displayed.
-
-
Create a trend configuration:
-
Click the
 icon.
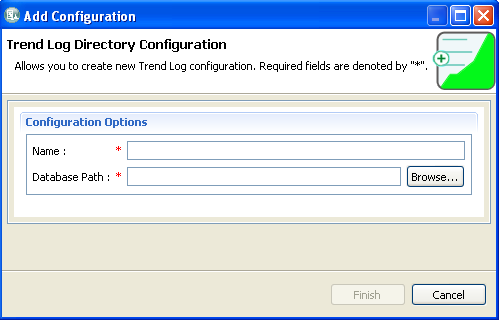
icon.The Add Configuration dialog is displayed.
-
In the Add Configuration window, provide the following information:
-
Name: A name for the trend configuration. This name is used as a reference for this configuration.
-
Database Path: The directory where the analyzed trend data must be stored. The same directory location must be used in future to analyze the trend or to add more trend data in the new or updated proxy server log file.
If you have two instances of the Trend Manager tool running, the same database path cannot be used in both instances.
-
-
Click :
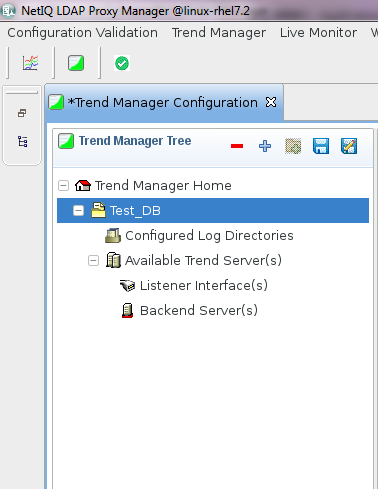
An hierarchical representation of the configuration is displayed in the Trend Manager Tree.
-
-
Specify the log files to be analyzed:
-
Right-click and click .
The Select Trend Server Log Directory window is displayed.
-
Specify the directory that contains the proxy server trend log files.
If the Trend Manager tool and proxy server are running on different systems, you can manually copy the log files from the system where you have configured the proxy server (/var/opt/novell/ldapproxy/log) to your local machine. This location must be defined in the LDAP proxy configuration.
The specified log directory is added to the Configured Log Directories tree hierarchy. You can specify multiple log files directories.
-
-
To analyze the server trend data, right-click the directory to be analyzed and click .
The tab is displayed. This tab displays the details of all the listener and back-end server log files available in the specified directory. This following details are specified:
-
Normalize Status: Whether the log file was processed by the Trend Manager tool. The status can be Not Done, Partial, or Done.
The first time you configure a log directory, the status shows as Not Done. When the log file is processed completely, the status changes to Done, or changes to Partial.
-
Server Type: Whether the log file is for a listener or back-end server.
-
Start Date/Time: The date and time when the trend data was first logged into the file.
-
End Date/Time: The date and time when the last trend data was logged into the file. This field is empty if the proxy server is still logging data into the file.
-
Log File Status: Whether the proxy server trend data is still being logged into the file. The status can be Complete or On Going.
If you copied the log file from the server while information was being logged into it, this status shows as On Going. If the log file was complete when you copied it from the server, the status shows as Complete.
-
Log File Size: The size of the log file.
-
File Name: The name of the log file.
-
-
Select the file that you want to analyze and click .
The data in the log file is processed and the available servers are added to the Available Trend Server node of the Trend Manager Tree. For instance, if you process a back-end server log file, the individual back-end server details are added as child entry to the back-end server node of the tree.
IMPORTANT:Do not exit the Trend Manager tool during the log file processing because all trend information will be lost. If it is necessary to cancel processing, click in the section.
-
(Optional) To update the log file information, click .
You might want to update the log file when you copy additional proxy server trend log files to the same local directory at a later time. The Trend Manager tool can identify and append the partially processed log file.
-
To analyze the data, right-click the listener or back-end server for which you want to analyze the trend, then click .
The Showing Trend Data page is displayed. This page displays an empty graph with Date/Time and Number/units as its X and Y axes.
-
To define the LDAP operations that must be used for trending, right-click the graph, then click .
The Events Selection Wizard window is displayed. It displays a list of events that can be used for trending, grouped into categories.
-
Select the events by clicking each category and selecting the check box corresponding to each event.
For more information about the listener and back-end events that can be monitored, see Table 4-1.
-
Specify the time period for trending:
-
Select the time unit in the drop- down list. The available options are Hour, Day, Week, Month, Quarter, and Year.
-
In the field, click the
 icon to specify the time period.
For example, if you specify the time unit as Week, specify the first day of the week from the calendar and the end date is set automatically.
-
-
Click .
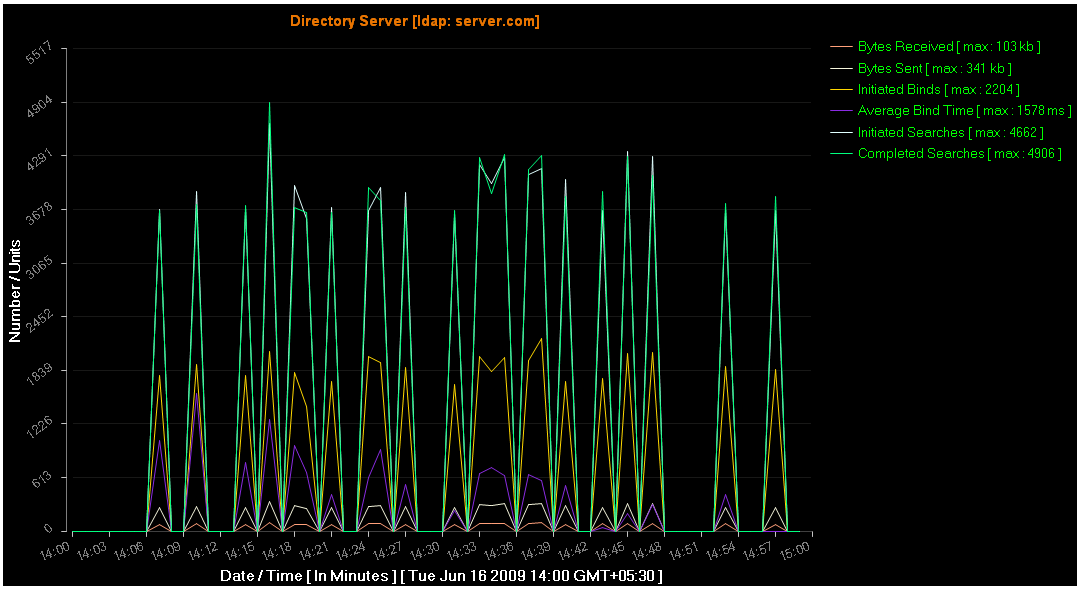
The graph displays the trending statistics of the selected LDAP operations for the specified time period. Each event can be easily identified by the color code assigned to it.
-
(Optional) To save the trending configuration, click the
 icon at the top.