4.1 Configuring Monitoring Activities
You can configure live monitoring of ongoing activities on the LDAP proxy and back-end directory servers. You can configure multiple proxy servers for live monitoring.
To use the live monitoring functionality, ensure that you have fulfilled the following prerequisites:
-
Ensure that the proxy server you want to monitor is running.
-
Ensure that a dedicated listener is configured to support monitoring. This listener must include a Connection Route policy that will reference a Search Request policy. To enable live monitoring, you must define the <do-send-monitor-response> element in this Search Request policy. For more information about the <do-send-monitor-response> element, refer to Example 3 in Evaluating Incoming Search Request (Search Request Policy).
-
Run the ./NLPManager command to start NLPManager.
The NetIQ LDAP Proxy Manager window is displayed.
-
Do one of the following:
-
Click the
 icon.
icon. -
In the menu, click .
The tab is displayed in the Editor pane.
-
-
Configure the proxy server to be monitored:
-
Click the
 icon in the .
The Proxy Server Details page is displayed.
-
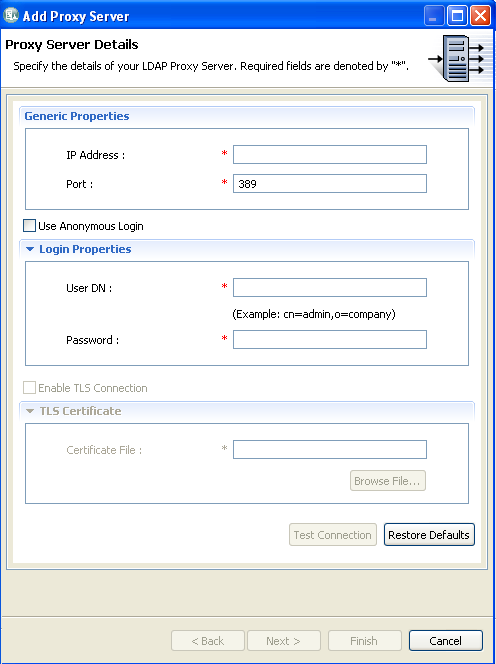
On the Proxy Server Details page, provide the following information:
-
DNS or IP Address: The IP address of the listener that is configured to enable monitoring.
-
Port: The port number of the listener that is configured for monitoring.
-
Use Anonymous Login: Select this option to get the monitoring statistics anonymously. If you select this option, you do not need to specify the User DN and Password.
-
User DN: The user credential of the back-end server configured on the specified listener.
-
Password: The password  to be used for authenticating the specified user credentials.
Currently, the TLS Certificate section is disabled.
-
-
(Optional) To validate the connection and test whether the specified proxy server supports monitoring, click .
If the validation fails, an error message appears at the top of the Proxy Server Details page.
-
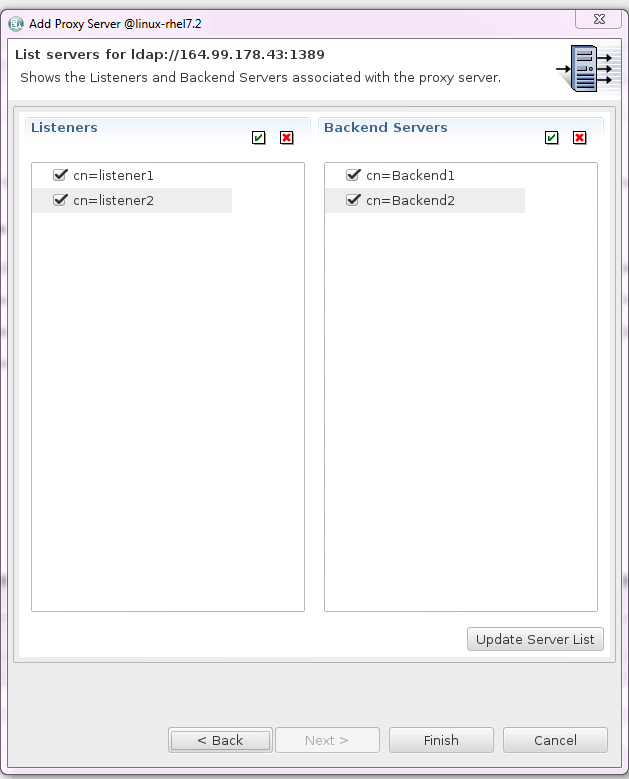
Click . A validation is performed to authenticate the connection and confirm that the specified proxy server supports monitoring.
The List servers for ldap page is displayed. This page lists all the listeners and back-end servers that are configured to the specified proxy server.
-
Select the listeners and back-end servers that you want to monitor and click .
By default, all the listeners and back-end servers are selected.
-
Click .
An hierarchical representation of the configuration is displayed in the Proxy Monitor Tree section.
-
-
Start live monitoring:
-
Right-click the listener or back-end server that you want to monitor and click .
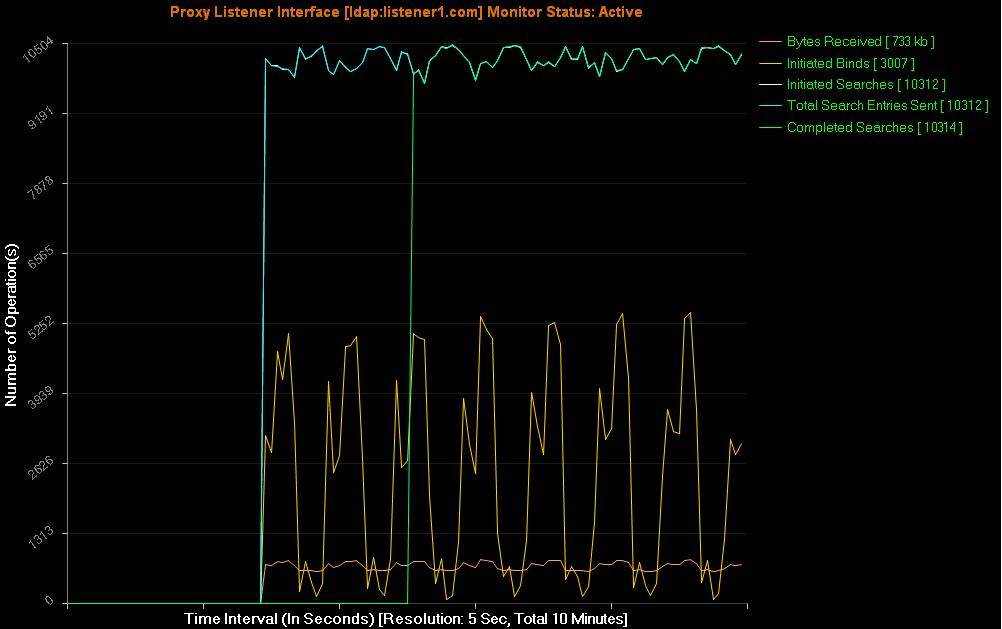
The Showing Monitor Data page is displayed. This page displays an empty graph with Time Interval (In Seconds) and Number of Operation(s) as its X and Y axes.
-
To define the events that must to be monitored, right-click the graph and click .
The Events Monitor Wizard is displayed. It displays a list of events that can be monitored, grouped into categories.
-
Select the events by clicking each category and selecting the check box corresponding to each event.
For more information about the listener and back-end events that can be monitored, refer to Table 4-1.
The graph displays the live monitoring statistics of the selected events for every five seconds.
-
To stop monitoring on a listener or back-end server, right-click the listener or back-end server and click . Alternatively, right-click the graph and click .
-
-
(Optional) To remove a proxy server from the Monitor Tree Home, right-click the server and click .
-
(Optional) To save the monitoring configuration, click the
 icon at the top.