3.40 SingleInterface_Health

Use this Knowledge Script to monitor the interfaces on a single network device. This script raises an event if the interface status changes or if any value exceeds a specified threshold. In addition, this script generates a datastream indicating the up or down status of the interface.

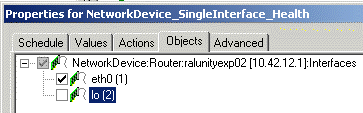
SingleInterface_Health differs from Interface_Health in that it allows you to choose which interface you want to monitor for a single device. On the Objects tab, select the appropriate interfaces. For example:

3.40.1 Resource Object

NetworkDevice

If you run the script on a large number of objects (roughly 100 or more), the Operator Console or Control Center console may take up to 30 seconds to display the Properties dialog box for the Knowledge Script. In addition, 100% of system CPU may be consumed during this 30-second period.

3.40.2 Default Schedule

By default, this script runs every 5 minutes.

3.40.3 Setting Parameter Values

Set the following parameters as needed.

Parameter

How to Set It

General Settings

Job Failure Notification

Event severity when job fails

Set the event severity level, from 1 to 40, to indicate the importance of the failure of the SingleInterface_Health job. The default is 5.

Event severity when job returns warnings

Set the event severity level, from 1 to 40, to indicate the importance of an event in which the job completes with warnings. The default is 25.

Event severity when monitoring fails

Set the event severity level, from 1 to 40, to indicate the importance of an event that is raised when monitoring fails. The default is 25.

SNMP Settings

SNMP timeout

Specify the length of time in milliseconds that the job should wait for the SNMP response from the monitored network device before timing out and raising a failure event. The default is 2000 milliseconds.

SNMP retries

Specify the number of times the job should attempt to get the SNMP response from the monitored network device. The default is 1 attempt.

Collect data for interface status?

Select Yes to collect data about interface status for charts and graphs. The default is Yes.

Event severity when interface goes down

Set the severity level, between 1 and 40, to indicate the importance of an event in which the interface status changes from Up to Down. Enter 0 if you do not want to raise an event. The default is 5.

Event severity when interface comes back up

Set the severity level, between 1 and 40, to indicate the importance of an event in which the interface status changes from Down to Up. Enter 0 if you do not want to raise an event. The default is 15.

Raise one-time events?

Select Yes to raise an event for all one-time events. For example, if you set this parameter to Yes, then, on the first iteration of this script, AppManager raises an event when a particular performance counter cannot be found.

If you do not want to see such one-time events, set this parameter to No.